
28.05.2026
The Visa Empire: Borders as a Business
Outsourcing giant VFS Global has made huge profits by exploiting people around the world whose ‘weak’ passports require them to apply for visas to travel
Published with



INVESTIGATION
VFS Global is paid to process visa applications in 153 countries on behalf of 68 governments around the world.
Our reporting, based on interviews with dozens of former employees and applicants around the world, suggested that VFS was coercing visa applicants to buy extra services that they didn’t need. Furthermore, the company’s financial statements suggested that these sales were critical to the company’s growth: applications increased just 15% from 2017 to 2024, but the company’s profits increased fourfold.
However, none of the financial documents we found would show us just how much the company earned from these services. This methodology focuses on how we analysed the receipts issued to applicants in order to answer that question.
Across countries, these receipts list the official visa fee, the standard service charge paid to VFS, and a series of additional services sold around the application process, SMS notifications, courier delivery, premium lounges, photocopying, form-filling support and other charges. Some charges are small. Others can significantly increase what an applicant pays.
This methodology explains how we turned scanned receipts into structured data, standardised fees across countries and currencies, and calculated how much applicants paid for value-added services across many countries.
The receipts allowed us to measure the financial costs to applicants and earnings by VFS. In the two-week sample we analysed, value-added services accounted for around 30% of VFS-related revenue. In South Africa, they made up as much as 47%.
In some countries, services labelled as “value-added” appeared on the vast majority of receipts, raising questions about how optional they are in practice. SMS notifications, for example, were purchased by more than 90% of applicants in Uganda, Ethiopia, Tanzania and Kenya in our sample. These findings had strong resonance with our reporting: former employees in Kenya, for example, had told us that staff would routinely add SMS notifications to customers’ bills without their permission.
The aim of the analysis was straightforward, to turn inconsistent scanned receipts into standardized evidence of what applicants were charged, how often additional services appeared, and how important those services were to VFS’s revenue.
First, we had to work out which countries actually held receipts. We obtained contracts from several countries with strong Freedom of Information laws, and analysed them to establish whether these countries were obtaining information from VFS which would detail their VAS fees.
This took us to Norway and Sweden. However, Norway treated the receipt as a part of each person’s application and therefore refused to disclose the receipts.
We submitted freedom of information requests to the Swedish embassies in Nairobi, Bangkok and Delhi, asking for a two-week sample of customer receipts for visa applications processed by those missions.
In total, we received receipts covering over 2,000 applications made from 16 countries in Asia and Africa. The samples covered two periods. For applications processed through Delhi, the receipts ran from 19 November to 3 December 2025. While applications processed through Nairobi and Bangkok, covered 3 June to 16 June 2025.
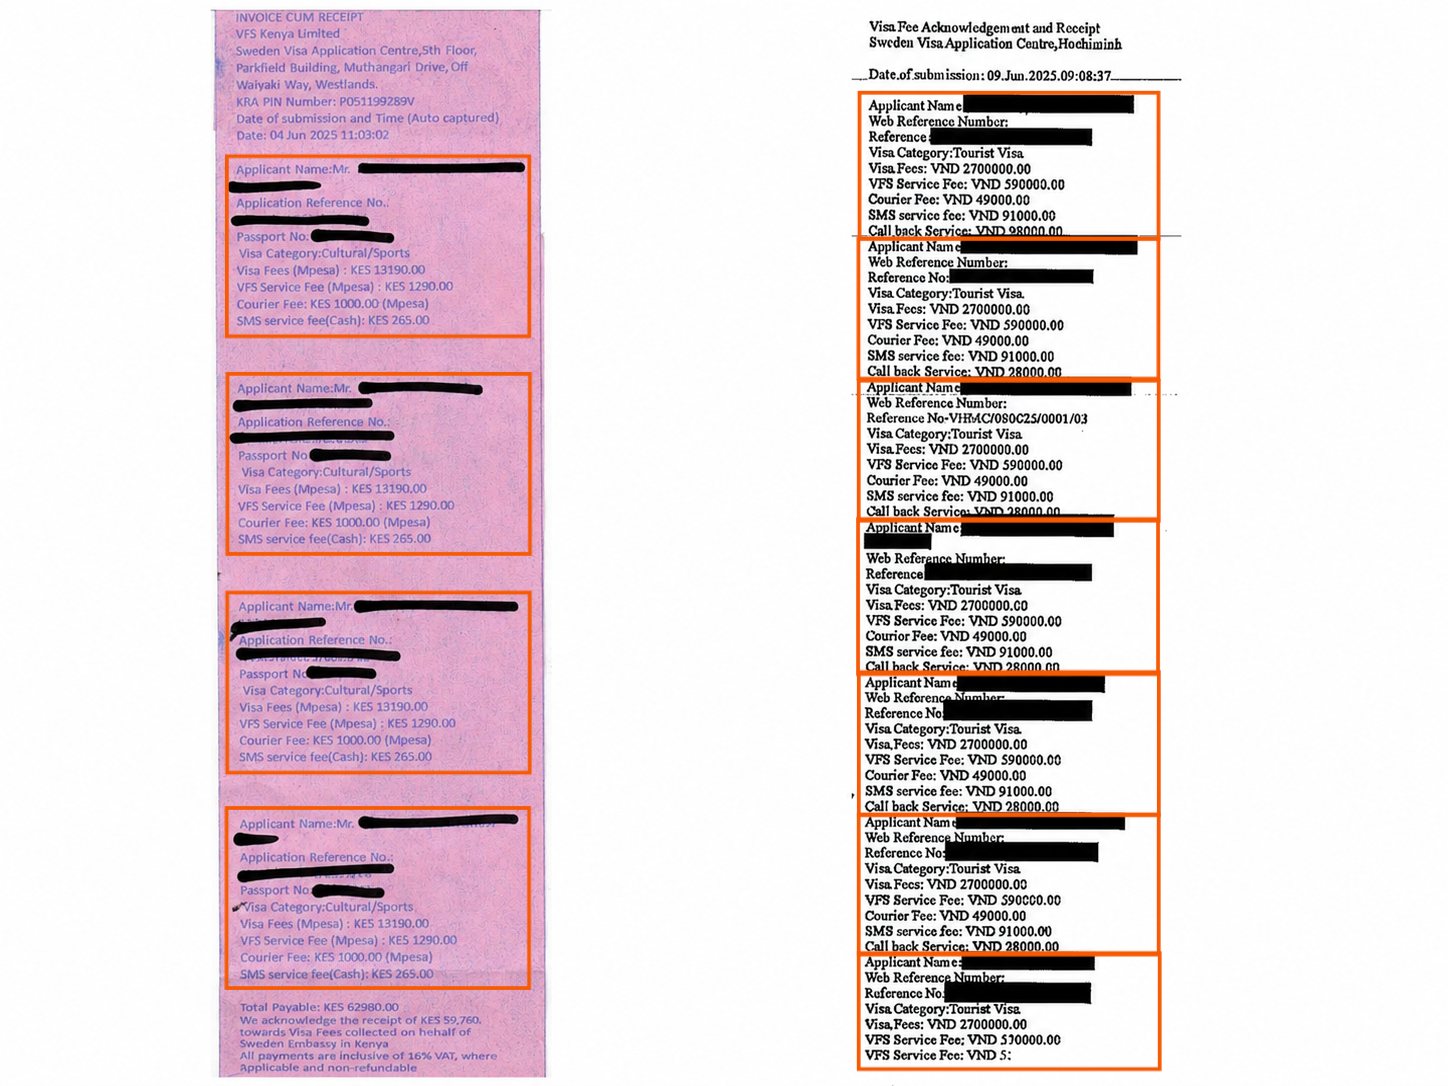
The receipts varied significantly by country and visa centre. All were provided as scans of receipts, which meant they first had to be converted into machine-readable text before they could be analysed. Some documents contained a single applicant, while others listed several applicants on the same receipt. In some cases, receipts were split across multiple pages.
Because the receipts were issued to applicants, we structured the analysis around what each person was charged. Where a receipt contained several applicants, the pipeline separated the fees linked to each applicant wherever possible. This allowed us to calculate both the total amount collected and the share of applicants who paid for at least one additional service.
The examples below show why the parser had to identify repeated applicant blocks within the same receipt:
As noted above, all receipts first needed to be converted from scanned image files into machine-readable text. We did this using optical character recognition, which produced structured optical character recognition (OCR) outputs that could then be searched and parsed.
For each page, the OCR pipeline we built tested different OCR model combinations and image treatments, including cropping, contrast normalisation, upscaling and rotation. It then selected the best result page by page using a quality score based on OCR confidence and text coverage. The final output was a structured JSON file containing the detected words, lines and pages, which could then be passed into the VFS-specific parsing pipeline.
From there, we built a pipeline to identify the key parts of each receipt: applicant details, visa fees, VFS service fees, and additional services. The parser relied on recurring labels and text patterns, but allowed for variation in wording and layout between countries.
Because the receipt formats differed between countries, we built country-specific extraction rules where needed. These rules looked for anchor phrases that marked important sections of the receipt, such as the beginning of an applicant block or a fee table. Around those anchors, the parser searched for fee names and amounts within a defined window of text. This made it possible to extract data from receipts that used different layouts while keeping the overall structure of the pipeline consistent.
Where the same service appeared under different names, we standardised it. For example, “SMS Service Fee” and “SMS Charge” were both grouped under “SMS Service Fee”. Similar standardisation was applied to courier fees, premium lounge charges and other common services.
The output of this stage was an applicant-level table. For each applicant, the table recorded the country, visa centre, visa category, and the fees and amounts charged to that applicant.
We grouped the fees listed on each receipt into three categories: the official visa fee, the standard VFS service charge, and value-added services.
The official visa fee is collected by VFS on behalf of the destination country as part of the application, but is not part of the company’s revenue. The VFS service charge is the standard fee paid to VFS for processing the application. Value-added services are the additional services sold alongside the application, such as SMS notifications, courier delivery, premium lounge access, form-filling support and other optional services.
This distinction is important because VFS’s revenue from an application is not limited to the standard service charge. The company also generates revenue from services wrapped around the application process. Some of these services may be genuinely optional, while others may be difficult for applicants to avoid in practice.
Most receipts could be parsed using the same overall logic: identify the applicant, extract the fee lines, standardise the service names and assign each charge to a category.
However, some countries and visa centres required additional rules because their receipts used different layouts or placed information in different parts of the document. Some receipts listed the amount charged on the same line as the fee name, while others placed the amount on the following line, requiring separate extraction logic.
In India and Vietnam, receipts from different visa centres used slightly different structures. In India, receipts also included some fees that were not actually charged to the applicant, but appeared on the receipt with an amount of zero. In Indonesia, some value-added services appeared in a separate section of the receipt, requiring an additional check to avoid missing or double-counting fees.
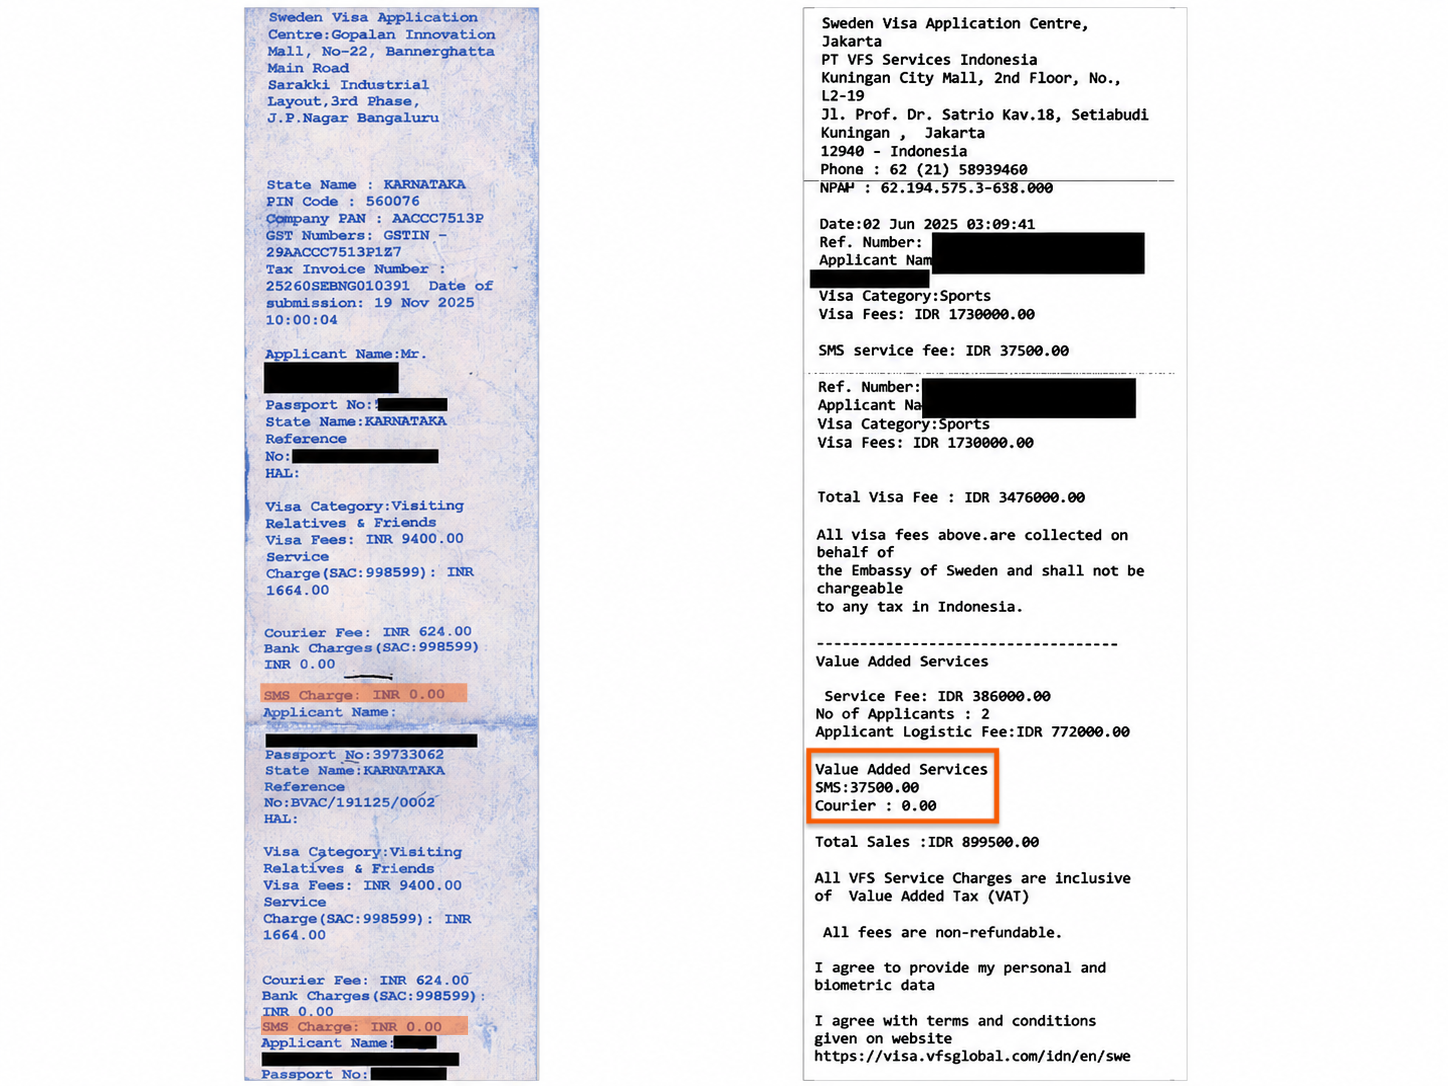
These country-specific rules were kept as narrow as possible. The goal was not to build a separate parser for every country, but to keep a common extraction pipeline and only add exceptions where the receipt format required it.
We checked the parsed output against the original receipts throughout this process, verifying that applicant blocks, fee names and amounts were being captured correctly. We then cleaned the extracted data using a country-specific list of expected fees, which allowed us to correct cases where OCR or layout issues had caused a known charge to be missed or misread.
Receipts were issued in local currencies, depending on the country where the application was submitted. To compare fees across countries, we converted all amounts into euros.
After extracting and cleaning the receipt data, we produced a euro-denominated version of the dataset using a fixed exchange-rate table. This made it possible to calculate global averages and compare the relative importance of value-added services across countries.
The exchange rates came from InforEuro, the European Commission’s monthly accounting exchange-rate tool. We used rates matching the sample periods: June 2025 rates for receipts processed through Bangkok and Nairobi, and November 2025 rates for receipts processed through Delhi.
Once the receipts had been parsed and standardised, we calculated the role of value-added services in two main ways.
First, we measured take-up: the share of applicants who paid for at least one value-added service, and the share who paid for each specific service. This allowed us to compare how common services such as SMS notifications or courier delivery were across countries.
Second, we measured revenue: the amount collected from value-added services, both in absolute terms and as a share of VFS revenue.
This produced country-level summaries showing the share of applicants buying any value-added service, the most common services in each country, the average amount applicants paid in value-added services, and the percentage of VFS revenue coming from those services.
Across the full sample, value-added services accounted for around 30% of VFS revenue. In South Africa, this rose to as much as 47%, while in Kenya (41%), India (40%) and Vietnam (35%), value-added services made up more than a third of VFS revenue.
SMS notifications were one of the most common charges across the sample, they accounted for 5% of VFS revenue overall, and in Uganda, Ethiopia, Tanzania and Kenya more than 90% of applicants paid for them, in some cases making up around 10% of VFS revenue in the country.
The receipts also showed that value-added services were not occasional extras in the sample. Across the 16 countries included in the analysis, nearly three-quarters of applicants paid for at least one value-added service, and more than a third paid for two or more.
In several countries, the rates were higher still, more than 90% of applicants in Kenya, Ethiopia, Nigeria, Tanzania and Uganda paid for at least one value-added service. In Nigeria, Ethiopia and Vietnam, a majority of applicants paid for two or more.
This analysis is based on the receipts we were able to obtain through freedom of information requests. It should not be read as a complete or statistically representative sample of all VFS applicants.
The receipts show what applicants were charged, but not the circumstances in which those charges were added. A value-added service listed on a receipt does not tell us whether the applicant wanted the service, was encouraged to buy it, or felt they had little practical choice. The receipts alone cannot distinguish between those situations.
We also excluded receipts from Zambia and Zimbabwe from our analysis. Although the Swedish embassy in Nairobi provided dozens of receipts from those countries, none of them listed any value-added services. Given how frequently such services appeared in receipts from other countries, we treated this as a sign that the receipts may not have recorded these charges in the same way, rather than as evidence that no applicants purchased them.
More broadly, the analysis is limited to the charges that appeared on the receipts we received. If some services were recorded separately or issued on separate receipts, they would not be captured here.
OCR and layout variation also introduce some uncertainty. While the pipeline was designed to handle inconsistent formats and was checked against samples of the original receipts, some errors may remain, particularly in low-quality scans.
Currency conversion adds a smaller limitation. Fees were converted into euros using monthly InforEuro rates matching the sample periods, but actual exchange rates may have varied slightly on the day each applicant paid. Given the short sample periods, this is unlikely to affect the overall findings, but it may slightly affect cross-country revenue comparisons.
Despite these limitations, the receipts provide a useful view of how VFS charges appear on applicants receipts in practice. They show not only the official cost of applying for a visa, but also the additional services charged around the application process and the role those services play in VFS revenue.

