
04.05.2026
Hiding Behind AI
How Kenya Used a Predictive Algorithm to Transfer Health Costs onto the Poorest
Published with

INVESTIGATION
In October of 2024, a graphic designer in western Kenya found himself questioning why the government wanted to know whether the walls of his home were made of plywood or mud. He was registering for the Social Health Insurance Fund, a sweeping effort to overhaul Kenya’s reportedly strained healthcare system, and the online form presented him with a series of questions that appeared both ridiculous and irrelevant. He was asked the source of his drinking water, if he uses a toilet that flushes, and whether he owns a bicycle.
His responses to these questions were fed into an algorithm that determined how much he would have to pay to access public healthcare. The algorithm, deployed by Kenya’s Social Health Authority, has calculated the public healthcare premiums of millions of Kenyans. In official statements, Kenyan officials have touted the tool, referred to as the “Means Testing Instrument,” as an objective way to ensure that households contribute their fair share in a country where most people work outside of the formal economy and few have official income or tax records. The system does not measure income directly. Instead, it uses machine learning to predict a household’s income based on 43 variables, ranging from the gender of the household head to whether their roof is made of tiles or iron sheets.
Kenya has been part of a long-running global trend in which algorithms are increasingly promoted across the Global Majority as neutral, efficient answers to intractable social problems. In Jordan, an algorithm determines who should receive cash transfers; in Peru, which elderly should receive a pension. The increasing spread and reach of these systems — and the life-changing decisions they make about some of the world’s most vulnerable populations — make journalistic scrutiny essential.
Over the course of more than ten months, Lighthouse Reports, in collaboration with Africa Uncensored and The Guardian, conducted an investigation into how a machine learning model is being used to set the health insurance premiums of millions of Kenyans. By obtaining the training data and variables, we were able to reconstruct the model in order to test its effectiveness and how it would calculate premiums for different kinds of people.
This methodology explains how we approached our analysis. The underlying code and full results have been published to Github.
The Social Health Authority did not respond to a detailed set of questions regarding the findings presented in this methodology.
In 2023, Kenyan president William Ruto decided to overhaul the country’s healthcare system. The long-standing National Hospital Insurance Fund (NHIF) was replaced with the new Social Health Authority (SHA). A stated goal of the reforms is universal health coverage, ensuring that all Kenyans have access to essential medical services.
The transition was accompanied by a wide-reaching digital infrastructure project, procured by a consortium of companies at a cost of more than a 100 billion Kenyan Shillings (~668 million euro). A central component was the development of an algorithm to assess how much money Kenyans should contribute in order to access the public healthcare system.
A challenge that faces social programs in Kenya is that more than 80 percent of workers operate in the informal sector. For these workers, there are no formal tax or employment records. Under the previous NHIF, formal sector employees had health insurance contributions directly deducted from their salaries. Informal sector workers could voluntarily enroll and pay a flat monthly contribution, regardless of income or living conditions.
Under the new SHA reforms, informal sector workers are required to enrol and pay 2.75 percent of their income as a health insurance contribution. To estimate that income, the government uses a machine learning model to predict a household’s income based on demographic, household and asset-based proxy indicators.
Kenya’s use of machine learning to estimate household income has roots in an academic methodology stretching back nearly three decades. In the mid-1990s, Margaret Grosh, an American economist at the World Bank, helped formalize a method known as the “proxy means test.” Faced with countries where few households had reliable income or tax records, Grosh and her colleague proposed that a family’s welfare could be estimated by observable household characteristics, such as the materials of their home or the education of household members, in order to determine their eligibility for social assistance programs.
The basis of most proxy means testing systems are socioeconomic surveys that collect detailed demographic and economic data from households, where the goal is to measure household ‘consumption’ — the total value of goods and services a household uses. In the context of proxy means testing, consumption is often considered a more reliable and stable measure of household prosperity than income, because households are more likely to accurately report what they spend rather than what they earn. A statistical model, typically a linear regression model, is then trained on the survey data to find characteristics that are correlated with consumption. This model can then be used to predict consumption for households outside the survey.
Since Grosh published her paper, the World Bank has described proxy means testing as a way to more effectively target social assistance. Various forms of proxy means testing models have been deployed in more than half a dozen middle and lower-income countries, including Egypt, Indonesia and Rwanda.
Proponents of proxy means testing have argued that they are an imperfect but practical tool for directing limited resources to those who need it the most. Studies have found that proxy means testing can be more effective at identifying poor households compared to other forms of targeting, such as having communities self-select vulnerable households. Critics argue that proxy means testing models are only moderately predictive of household wealth. A report commissioned by AusAid, the aid body of the Australian government, found that the percentage of poor households predicted by proxy means testing models to not be poor can range from 44 percent to 71 percent in a set of four countries. Some critics also note that communities on the ground can view the classifications as arbitrary or opaque.
The proxy means testing model deployed by the Kenyan government to determine healthcare contributions relies on linear regression, a simple form of machine learning. Linear Regression models look for the best straight line relationship between a variable and an outcome. The model assigns each variable (e.g. gender of household head, owning a fridge) a coefficient, or weight. To make a prediction, it multiplies the value of each variable by its weight and then sums the results.
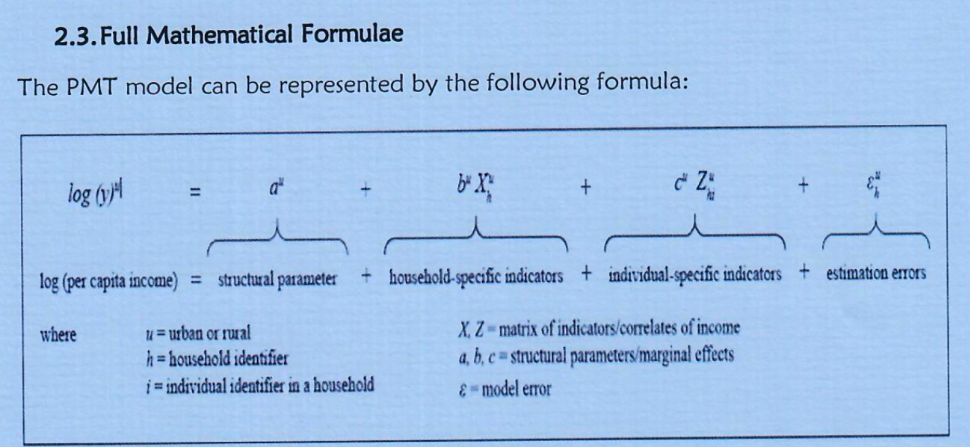
In response to an Access to Information request, the Social Health Authority wrote that the means testing model is trained on the 2021 Kenyan Continuous Households Survey (KCHS). The KCHS is a representative survey of 17,000 households collecting demographic information, household characteristics and a detailed record of all assets a household owns. This data is used to estimate per-capita consumption for each household. The means testing model is trained to predict the log of per-capita consumption. Since consumption tends to be highly skewed (e.g. a small number of wealthy households with very high consumption), taking the log compresses the scale. Taking the logarithm of skewed variables like income or consumption is common in econometric analysis.
In total, the model makes use of 43 different variables, which broadly can be grouped in the categories below.
The model is in effect made up of two submodels, one for urban households and one for rural households. Each of the variables can take on different weights depending on the submodel. For example, the number of rooms in a house may have a higher weight in the urban model than the rural model.
In order to reconstruct the model, we obtained the complete 2021 Kenyan Continuous Households Survey (2021 KCHS) from the Kenyan National Bureau of Statistics’ microdata catalogue. In some cases, specific variables (such as asset ownership) collected in the survey were not available in files on the microdata catalogue. We obtained those variables directly from the Kenyan Bureau of Statistics.
The 2021 KCHS contains hundreds of variables and we were unclear which variables were ultimately chosen for the model. In August 2025, Africa Uncensored sent a public access request to the Social Health Authority requesting, among other things, the exact formula, variables and weights used in the model. When the Social Health Authority refused to acknowledge our request, we complained to the Ombudsman, who ordered the authority to respond. In November 2025, the Social Health Authority responded to our request, confirming that the model had trained on the 2021 KCHS and disclosing the model formula and the variables used, but not the coefficients for each variable.
We matched each of the variables to questions in the 2021 KCHS questionnaire. In most cases, the variables directly matched those in the questionnaire. A smaller number of variables were calculated based on other fields, like the proportion of working age men and women in a household.
To reconstruct the model, we first restricted the KCHS survey to contain only variables used in the model. We then split the survey into separate rural and urban datasets. Each dataset was subsequently divided into a training set containing 80 percent of the surveyed households and a test set containing the remaining 20 percent. Finally, we fit standard Ordinary Least Squares (OLS) regressions, as specified in the formula released by the ministry in their FOI response, to the rural and urban training sets.
We attempted to replicate the model as best we could using the training data, variables and formula provided by the Social Health Authority in response to our access to information request. It’s possible that the agency may have carried out additional steps not reflected in the materials, such as data cleaning, imputation of missing values, or post-estimation calibration. If so, our replication will not perfectly mirror the actual model.
Still, our replication also produces urban and rural R-squared values comparable to those reported in an academic working paper on a means testing model built on the same dataset, authored by at least one researcher involved in the early development of the Social Health Authority’s system.
Many of the findings below are endemic to linear regression-based means testing models and surface fundamental issues that are arguably inherent to the approach. Moreover, our overall findings are consistent with accounts from sources involved in the design and rollout of the Social Health Authority’s model.
At a high level, auditing the model requires comparing its predictions to the ground truth. We used the model to predict the consumption of every household in the test set. We then compared the predicted consumption to each household’s actual consumption, which is estimated by the Kenyan Bureau of Statistics based on detailed tabulations of household assets and expenditures.
The chart below compares the model’s predictions (y-axis) to actual consumption (x-axis). Each dot is an individual household. If the model’s predictions were perfect, the dots would fall along the dashed red line. Instead, they scatter. Households above the line are having their consumption overpredicted by the model — they would be charged a higher insurance premium than they should be. Those below the line are having their consumption underpredicted and would be charged a lower insurance premium than they should be. The further a household sits from the line, the greater the error.
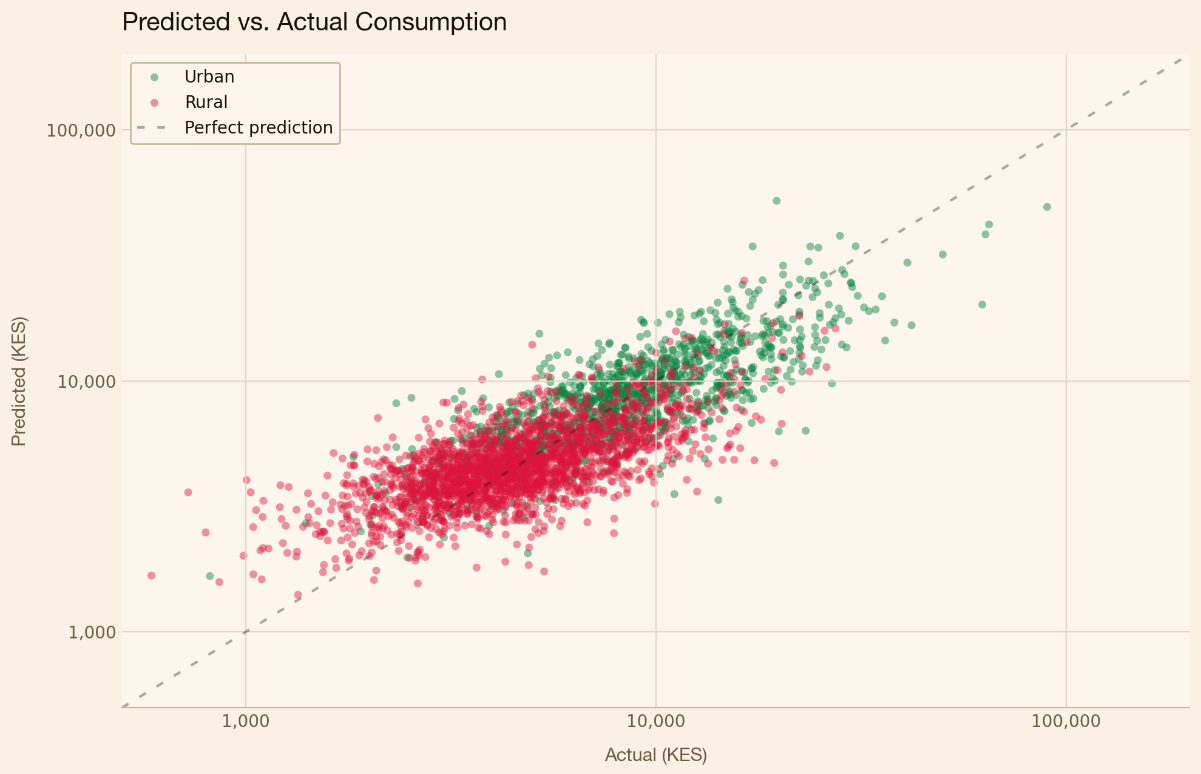
Overall, the urban submodel is more predictive of income than the rural submodel. The R-squared value, which measures how much of the variance in consumption is explained by the model, is 0.66 for the urban submodel and 0.46 for the rural submodel. These values are broadly consistent with those found in PMT models deployed in other countries.
The numbers show that, overall, the model is detecting real correlations between the data it uses and the household wealth it’s trying to predict. Still, even while the model may be moderately predictive overall, it still fails to correctly predict household wealth in many individual cases. Since the premium is 2.75 percent of predicted consumption, any error in the model’s predictions means a household will be over- or under-charged.
The model struggles most at the extremes. Amongst the poorest households, 16 percent are predicted correctly and 80 percent have their consumption overpredicted. While the wealthiest households are more likely to be correctly predicted, more than 60 still have their consumption underpredicted.
In other words, the system overcharges the poorest Kenyans while undercharging the wealthiest Kenyans. In effect, this means that the most vulnerable households, living on the thinnest margins and least resilient to a medical shock, are also the most likely to be charged a premium they cannot afford.
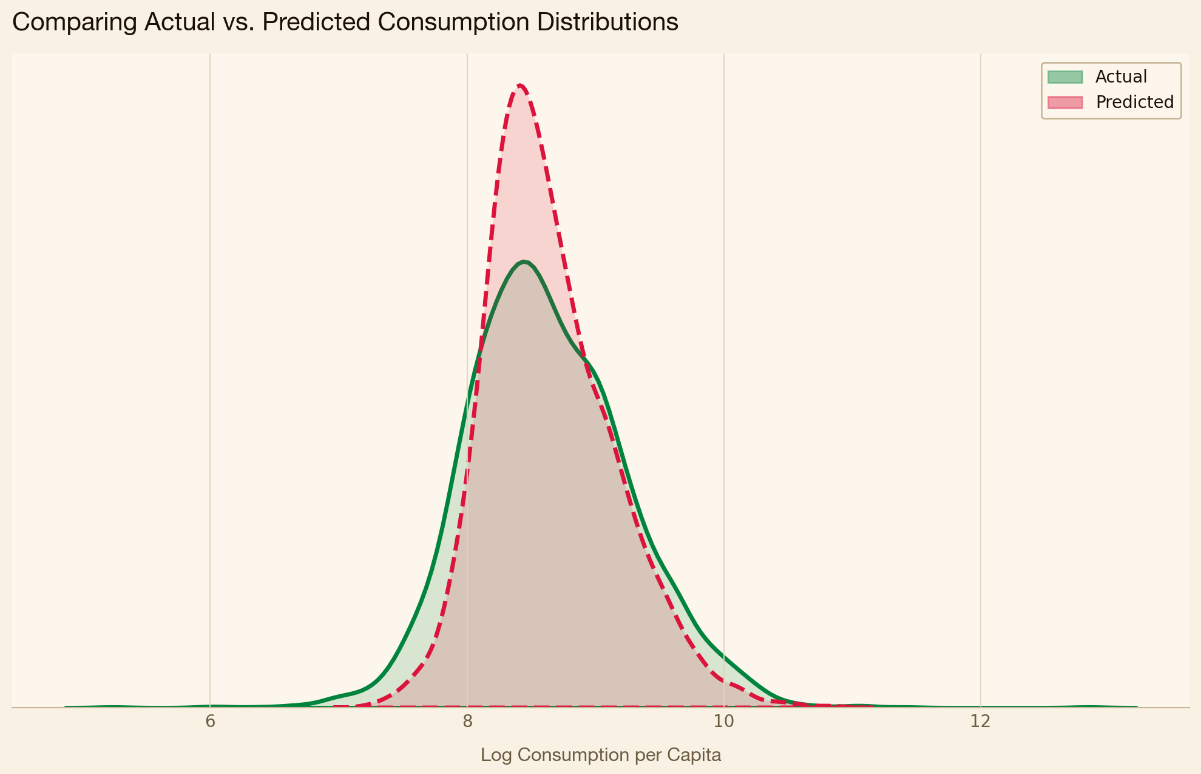
Linear regression–based means testing systems tend to overestimate the incomes of the poorest households while understating those of the richest, a pattern rooted in the method’s underlying mathematics. Regression, by its nature, predicts towards the center. While this feature of regression is well known in academic circles, some academics have noted how it can be particularly problematic in the context of proxy means testing. One academic study published in the Journal of Development Economics pointed out that means testing models based on linear regression struggle in the tails of the wealth distribution.
The pattern is evident in our data. In the density chart below, the model’s predicted consumption is more tightly clustered than true household consumption, with thinner tails at both ends. The result is a system that struggles to accurately capture those at the top and bottom of the distribution.
A key goal of Kenya’s healthcare reforms is universal healthcare coverage, ensuring that everyone, regardless of income, can access care. In a 2023 speech, Kenyan president William Ruto promised that “no Kenyan will be left behind” under the new reforms.
We wanted to understand how the Means Testing Model assesses the poorest households in Kenya.
Within the academic literature, researchers typically define two types of errors when evaluating Proxy Means Testing models. The first is an exclusion error: a household that is actually poor is predicted to be not poor. The second is an inclusion error: a household that is not poor is predicted to be poor.
One way researchers calculate these errors is by constructing a confusion matrix, a simple table that compares who is actually poor to who the model predicted to be poor. Below is a confusion matrix for rural households showing how the model’s predictions compare to actual household wealth in our test set. “Actually poor” is defined as any household living below the 2021 poverty line calculated by the Kenyan Bureau of Statistics, which is Ksh 3,947 Kenyan shillings (~€26 EUR) per month for rural households and Ksh 7,193 Kenyan shillings (~€48 EUR) per month for urban households.
The exclusion error rate (sometimes referred to as “false negative rate” in machine learning literature), is formally defined below. It captures the share of actually poor households who the model classifies as non-poor. The number of households wrongly predicted as non-poor (false negatives) becomes the numerator, while the total number of actually poor households (the sum of true positives and false negatives) becomes the denominator.

The inclusion error rate (sometimes referred to as “false positive rate” in machine learning literature), works in the opposite direction. It measures how often non-poor households are classified as poor.

The exclusion error rate increases as households become poorer. Amongst the bottom 40 percent of households — roughly the poverty line determined by The Kenyan Bureau of Statistics — the model exhibits an exclusion error rate of 39 percent. In other words, 4 in 10 households within the poorest 40 percent are predicted to fall outside this group; the model places them above the bottom 40 percent.
We decided to focus on exclusion errors because the stated goal of the SHIF reforms is universal healthcare coverage — any household wrongly left out therefore represents an important failure.
Within the bottom 25 percent of households, exclusion errors are higher, with more than half of households predicted to have incomes above the 25th percentile.
Much of the academic literature on Proxy Means Testing models focuses on overall model performance and aggregate exclusion and inclusion errors. Few, if any, papers examining PMT models look at differences in exclusion errors between different demographic groups. This is in contrast to the machine learning fairness literature, which extensively focuses on between-group differences of various quantitative fairness metrics. We wanted to apply these metrics to the PMT model developed by SHA in order to check whether it has, for example, a higher exclusion error rate for women than men, or for households in a particular county. We define an exclusion error as a household that lives below the poverty line but is predicted to be above it.
In order to understand whether the model was more likely to misclassify particular types of people, we identified a set of characteristics of interest. Some of these variables are directly used in the model, while others are based on data collected in the 2021 Kenyan Continuous Households Survey.
For the most part, the results follow a consistent pattern. Overall, poor households have a significant chance of being misclassified as non-poor. However, certain groups are less likely to be misclassified than others. The model identifies real correlations between specific characteristics and household wealth. Truly poor households that deviate from these characteristics, such as having access to electricity, will have higher exclusion rates.
Households that have access to electricity are less often actually poor than households without electricity. At the same time, poor households with electricity are more likely to be excluded than poor households without electricity. In other words, the model has learned a real relationship between access to electricity and household wealth, but it predicts far fewer households with electricity to be poor than there actually are.
A similar pattern emerges when looking at demographic characteristics. Generally speaking, households with a greater share of women are less likely to be poor than households with a greater share of men. Yet mostly female households that are poor are more likely to be classified as non-poor.
The same pattern repeats itself across a number of variables. Generally speaking, poor households in more disadvantaged counties are more likely to be correctly classified than poor households living in more affluent counties. Similarly, poor households where the household head has completed secondary school are more likely to be misclassified as non-poor. In the case of variables like having a high school or university diploma, one could think of the the model as an estimator of “latent” earning potential, e.g., a highly educated person may have higher earning potential than somebody who only finished primary school, even when a household’s current income is low.
To identify which variables drive exclusion, we ran an OLS regression with exclusion as the dependent variable and the full set of model variables, along with consumption, included as predictors. In effect, this approach isolates which factors are most strongly associated with a household being misclassified as non-poor, while controlling for other variables.
The chart below shows the effect of a selected subset of variables that exhibit a statistically significant association with a poor household’s likelihood of being excluded.
Over the course of our reporting, we obtained a document from IDinsight, an international consultancy contracted by SHA to evaluate its model. The report, authored just before the system’s 2024 launch, found that the model was “inequitable, particularly for low-income households” and the 2021 Kenyan Continuous Households Survey used to train the model was out-of-date with the current socio-economic condition.” Unless new training data was used, the report found that the system was “highly likely to miscalculate means and the corresponding contributions, particularly for low-income households”.
The report also set out a series of recommended changes — proposals that differ from the account SHA later provided in a freedom of information response sent a year after the report was completed. This included the use of a two step prediction process made up of logistic regression models. An initial model categorizes households into broad income tiers — low, middle or high income — followed by a set of specialised models within each tier that place households in finite bands.
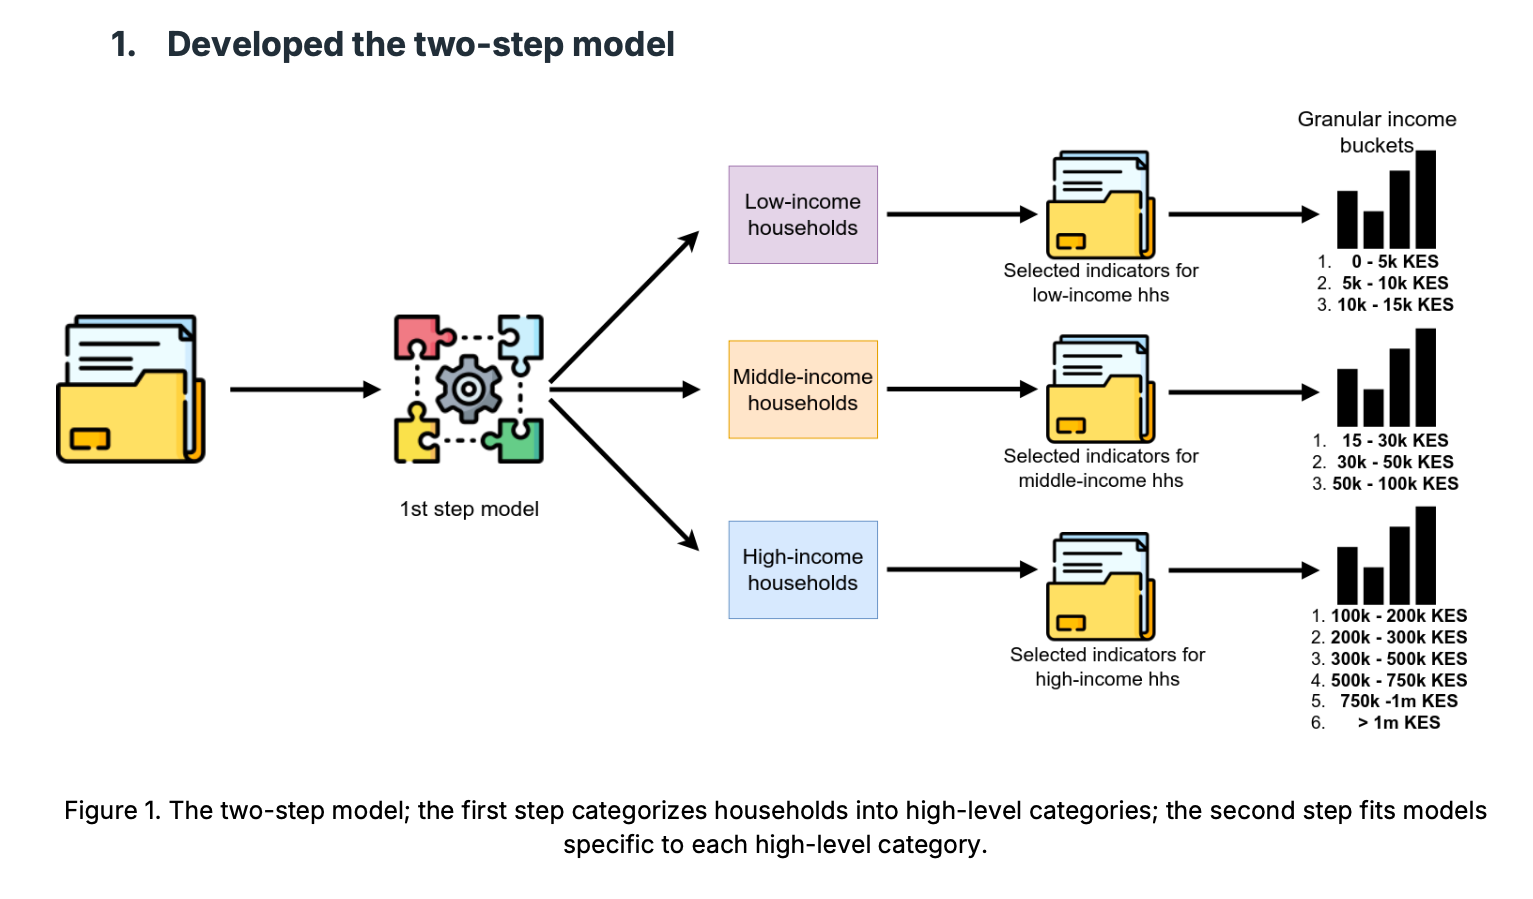
The report recommended other changes, too, including a series of hardcoded post-prediction rules that reclassify households. For example, all households where the head of household is not working, a housewife, or retired are automatically moved to the 5k-10k KES income band. They also recommended removing certain asset and demographic variables from the first step model, which classifies households as low, middle or high income.
We replicated the changes proposed in the report and tested the resulting system against a set of households in the 2021 KCHS Survey. We found that the changes reduced the overall accuracy of the model. This includes low income households, a larger share of whom ended up overcharged compared to the OLS-based model outlined in the FOI response. We found that 54 percent were classified correctly (i.e. placed in the correct final band) by the OLS-based model, whereas 47 percent were classified correctly by the two step logistic regression model.
Across both models, nearly half of low-income households had their earnings overestimated, placing them in higher income brackets than they actually belonged to.
Looking at individual rows in the data shows how the model’s predictions — and mistakes — manifest on the level of real people.
One such example comes from Murang’a County, where an elderly farmer and his wife live in a modest home made of brick and iron sheets. Their primary source of drinking water is rain water. They reported to surveyors that they sometimes skip meals, because they do not have enough food. The model estimates this household’s income as higher, in part because it has a covered toilet, owns a radio and the head of the household has completed a year of vocational school. Despite living far below the poverty line, the means testing model would charge them more than 2.5 times higher than it should be.
Another example comes from Meru County, where a young woman lives alone in a rented home. She works as a farmhand and usually walks four kilometres to get to her job. She reports eating less than she would like to. The model overestimates her income, in part because her home has wooden walls, she has electricity, she finished high school, and she lives in Meru county. The model estimates her income to be nearly twice as high than it actually is.
Our analysis comes with several limitations. We did not have access to the exact model used by the Social Health Authority and instead reconstructed it using the training data, variables, and formula disclosed in an FOI response. As a result, the reconstructed model may not fully match the original implementation, and the specific figures reported here may therefore also differ.
With that said, several of the issues highlighted in this methodology are documented characteristics of proxy means testing. These include its generally moderate predictive performance, its limited accuracy at the extremes of the distribution, and its tendency to exclude genuinely poor households that exhibit characteristics typically associated with higher income. Many of these issues were also explicitly recognized by both on-record and off-record sources involved with the development of the model for the Social Health Authority.
Another limitation is that our analysis evaluates the model against the 2021 Kenyan Continuous Households Survey. In practice, however, the model is applied against households registering for the Social Health Authority through an online, self-reported form. Households may misreport — either intentionally or unintentionally — key details about their income, assets, or living conditions. If such misreporting occurs systematically, some of the disparities identified above may not appear in real-world implementation, or could manifest differently.
In the Social Health Authority’s response to our access to information request, the agency said that it attempts to automatically pull values for variables via government databases to ensure “authentication and avoi[d] cases of self-entry for the required variables.”
Lastly, our analysis does not compare proxy means testing to other forms of targeting, such as geographic targeting or universal coverage. As a result, we cannot make claims that proxy means testing works better or worse than available alternatives, only that it carries the limitations described above.
Special thanks to Dr. Irene Irungu, Dr. Caitlin Brown, Dr. Cynthia Liem, David Nolan.

