U.S. Immigration and Customs Enforcement claimed that nearly 200 people, “the worst of the worst illegal criminal aliens” were arrested in Nashville. Records reveal that Tennessee Highway Patrol and ICE racially profiled drivers, and that majority had no criminal record.
Published with
Justin-Casimir Braun, Jack Sapoch, Meghnad Bose, Sarah Grace Taylor, Stephen Elliott, Melissa Lewis, Melissa Del Bosque, Seth Freed Wessler, Eva Constantaras, Klaas van Dijken, Gabriel Geiger
Combining bodycam footage, police reports, and more than a million ICE records, this is how we investigated Tennessee Highway Patrol's collaboration with ICE
February 19, 2026
In May 2025, Immigration and Customs Enforcement (ICE) agents teamed up with Tennessee’s Highway Patrol in an operation that targeted Latino drivers in Nashville. State and federal officials claimed they were after the “worst of the worst criminal illegal aliens.” ICE said its agents arrested 196 people during the week-long operation. State troopers, with ICE agents riding in their squad cars, used traffic stops to question occupants in more than 600 vehicles. Since then, Tennessee officials and ICE have refused to release any information, beyond their initial statements, about who was arrested and why. Even Nashville leaders, who were not notified about the operation in advance, have been largely blocked from learning what happened in the operation. Until now, there has been no definitive investigation into this Tennessee-abetted ICE operation. In this six month collaboration with Nashville media partners, we set out to provide answers for residents and city leaders about who was arrested, what happened to them, and how the operation impacted immigrant families and the city. We also scrutinized the role that Tennessee Highway Patrol played in what one attorney called “roving immigration patrols”.
To determine who was arrested during the operation, we analyzed more than a million ICE records released by the Deportation Data Project. The data trove contains anonymized individual level ICE records covering arrests, detainers, and detentions from September 2023 to October 2025, in addition to encounters and removals data from September 2023 to July 2025.
By linking these data with bystander video, police dashcam and bodycam footage, and highway patrol incident reports, we reconstructed the anatomy of the operation carried out by ICE and Tennessee Highway Patrol. This methodology shows how we used these data sources to identify people arrested during the operation, to test ICE’s claims against what really happened and to tie individual stories to regional and national trends in immigration enforcement under the Trump administration.
Highlights of our findings include:
● Arrests in Tennessee have surged under Trump, even as ICE has arrested a smaller percentage of people convicted of a crime, mirroring national patterns.
Community ICE arrests, which have been criticized nationally, have a far lower than average success rate in apprehending people with criminal convictions.
● Arrests in Tennessee spiked in early May 2025 when ICE collaborated with Tennessee Highway Patrol to carry out traffic stops and arrest undocumented drivers.
● DHS lied about who was arrested during the traffic operation, falsely giving the impression that it led to the arrest of a rapist and a drug dealer. In addition, it is very likely that DHS overstated the number of arrests it made.
● We identified who was arrested in the operation. We can show that few of them had serious criminal backgrounds, mirroring regional and national patterns.
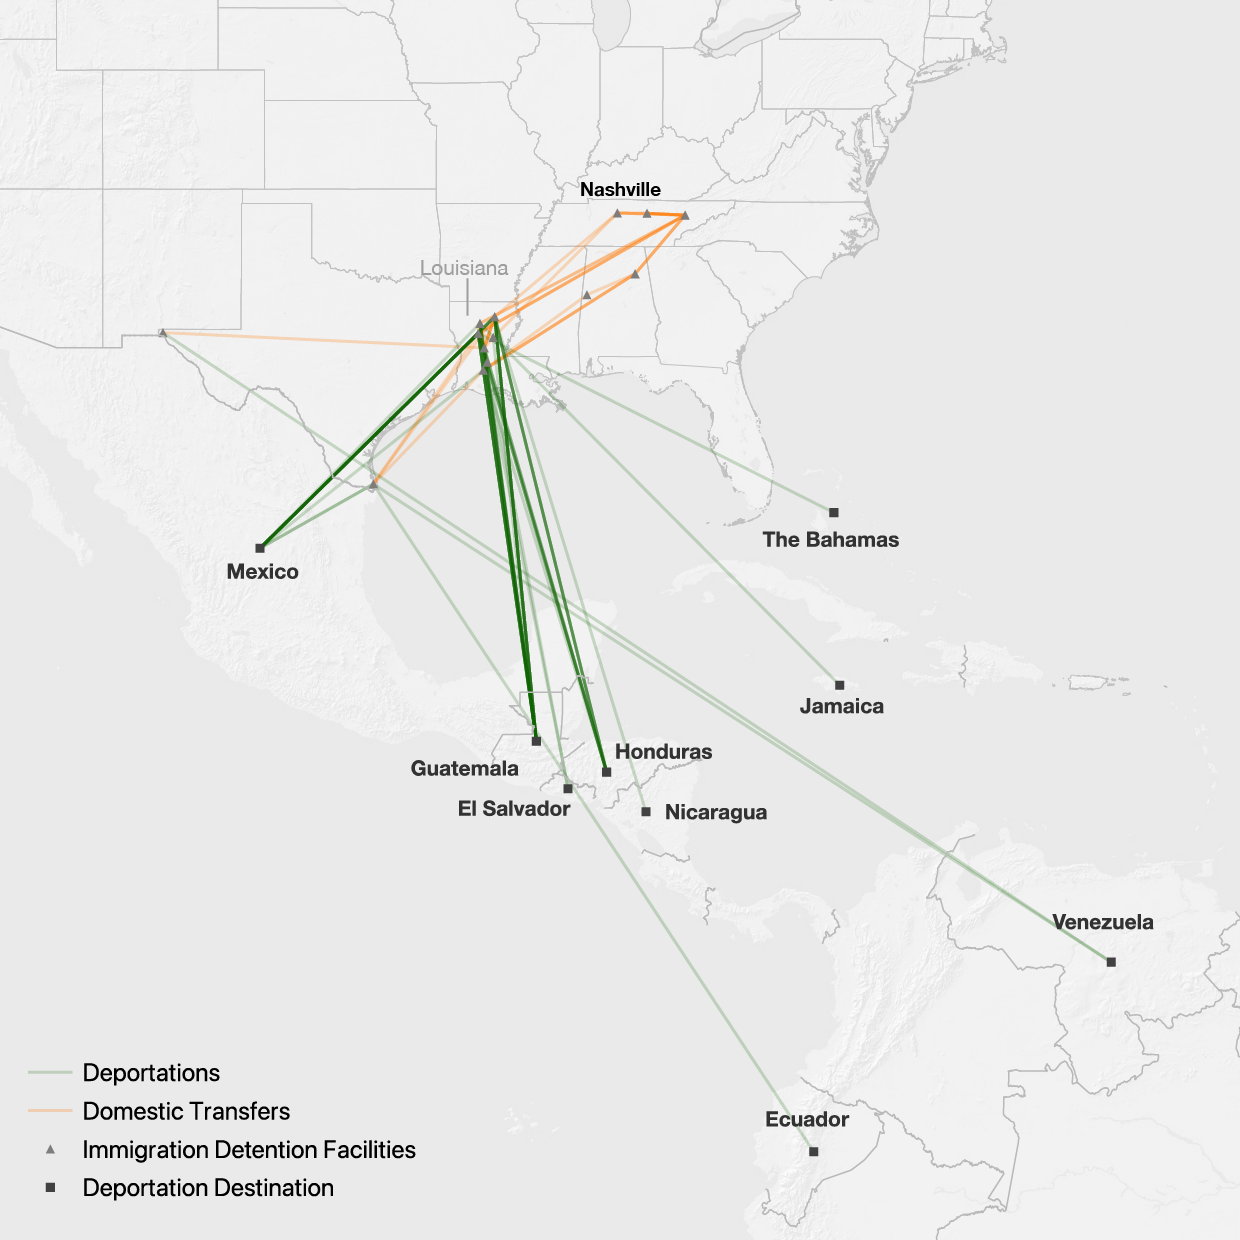
● We traced ICE arrestees through a succession of detention facilities. Most were quickly transferred to Louisiana and Texas, places with very low access to legal support, before being deported.
All of the code used for analysis is available on our Github.
Focus on Nashville
While many states, including Illinois and Minnesota, have sought to limit ICE and DHS operations in their states, Tennessee’s Republican leadership is deploying state assets, such as the state Highway Patrol, to work directly with ICE. Immigration arrest numbers have increased, as state law enforcement has supported the federal government’s enforcement actions, yet the share of people with criminal convictions among ICE detainees has fallen.
Since Trump was inaugurated, ICE arrests have more than doubled to 23,000, from a monthly average of fewer than 10,000 during the Biden administration. The increase in arrests has varied across the country. In New York, for instance, the increase has been modest, compared to other parts of the country. The Miami Area of Responsibility (AORs are ICE regional designations) and New Orleans AOR, which includes Nashville, saw the largest increase in arrests of anywhere in the country– tripling in Miami and more than doubling in New Orleans. The New Orleans AOR is also significant because it plays a crucial role as a staging ground for deportations and because the remoteness of detention centers in the region locates detainees far from access to vital legal support.
In Tennessee specifically, arrests doubled , from around 10 per day to more than 20, after Trump was inaugurated. An especially pronounced spike in arrests is visible in early May 2025 during the operation in which ICE collaborated with Tennessee Highway Patrol to ramp up arrests.
Tennessee Highway Patrol is not the only local law enforcement agency that has collaborated with ICE. Throughout the country, an increasing number of law enforcement agencies are signing 287(g) agreements, which deputize local law enforcement agencies to become immigration enforcement for ICE. The Tennessee Highway Patrol, too, has now signed a 287g agreement with ICE, however, it was not yet in effect during the May operation, which means that the state police were assisting ICE outside of the parameters of any formal law enforcement agreement. Local officials have wide discretion over the extent to which they honor detainers – requests by ICE to hold and hand over individuals held in local jails.
Tennessee presents a different image: both the rate of detainers issued and the share of detainers that result in ICE custody have increased substantially since Trump was inaugurated. The Davidson County Jail saw an increase from 50.5% to 59.8% in the share of “honored” detainers (detainers that resulted in ICE detention). Rutherford County Jail, in the Nashville suburbs meanwhile, saw an increase in the share of “honored” detainers (detainers that resulted in ICE detention) from 50% to 67%.
Not only did the number of arrests increase, there was also a marked shift in who was arrested. In Tennessee, Venezuelans made up less than 4% of arrests during the Biden era but almost 8% under Trump (nationally, the figures are 4.8% and 6.7%). Many Venezuelans entered the US legally under temporary protection status granted by the Biden administration. Trump has since removed this protection status, in effect creating a new class of undocumented immigrants.
ICE categorizes detainees by their criminal background into “threat” levels: at one end are people without past convictions, at the other end, aggravated felonies includes the most serious crimes like murder and rape. But less serious crimes, such as the use of false documents, can be classified as aggravated felonies, too. In between lie the categories “felony/repeated misdemeanor”, which includes e.g., simple assault, resisting officers and convictions for illegal re-entry, and “minor crimes”, which includes traffic offenses, DUIs, and illegal entry.
Overall, under Trump, immigration detainees are more likely to have a prior criminal record than under Biden: the share of detainees with a criminal record has risen from 25.3% to 36.2% under Trump. To put these numbers into perspective, approximately 1 in 3 US adults have a criminal record The increase in immigration detainees with a criminal record under Trump can be explained by the sharp reduction in border crossings since Trump came into office: Under Biden, 61.7% of immigration detainees were arrested by Border Patrol, under Trump only 14.3% are. Very few of the detainees arrested by Border Patrol have a criminal record in the US – they only just arrived in the country. So fewer border crossings almost automatically mean that the share of detainees with a criminal record increases.
If we focus on immigration detainees who were arrested by ICE, it is clear that ICE is now arresting a far larger share of people without a record of criminal convictions. The criminality for community arrests, or ICE agents picking up people from streets, schools or their homes, fell from 45.6% under Biden to around 26.6% under Trump. DHS touts that they arrest the “worst of the worst” during federal deployments across American cities. But the data show that a smaller share of aggravated felons are arrested during spikes in ICE arrests.
The graph below plots the intensity of a month’s arrest efforts on the x-axis: values greater than zero indicate more arrests than usual. Under both Biden and Trump, heightened deployments coincide with smaller shares of criminals arrested. Statistical regression analysis confirms this trend. The New York Times similarly finds similar results for a number of major federal deployments.
For non-community ICE arrests, the percentage of detainees with criminal records decreased from 64% to 47.3%. Most of these other ICE arrests are “custodial” arrests where ICE arrests immigrants held by local or state jails. This does not mean that the person has been convicted of a crime; often ICE will detain people held in local jails before they have been convicted and even if they have been acquitted. There are two possible explanations for why the share of people with a criminal record arrested in this way has fallen so dramatically under Trump. Either jails are handing over an increasing number of detainees without a criminal conviction to immigration enforcement because they face compliance pressure, or there are a higher number of detainers being issued for detainees without a criminal record. In either case, ICE’s tactics are resulting in arrests of a greater share of people without criminal convictions.
In short, the enforcement operation in Tennessee reflects national patterns: overall arrest numbers have spiked, more people from formerly protected countries such as Venezuela have been arrested, and the share of ICE arrests of people with criminal convictions has decreased, especially during deployment spikes.
Identifying Individuals Arrested in the Raid
On May 13, DHS issued a press release, stating that 196 individuals had been arrested in the Nashville area during the highway patrol operation, of whom 95 had prior criminal convictions.
Finding the arrestees in the Deportation Database Project data
The DHS press release cites a handful of arrests including a man convicted for dealing methamphetamine, and another person convicted of rape. By using their age, criminal history, and citizenship, we were able to identify all of them in the data. The arrests dataset includes a “landmark” field, which usually gives the most geographically detailed information about the arrest location. All of the men from the press release had the same landmark tag: ‘’NSV GENERAL AREA, NON-SPECIFIC”.
To identify others arrested during the operation, we extracted all individuals who were marked with ‘’NSV GENERAL AREA, NON-SPECIFIC” and arrested between May 1 and May 13, the day the press release was issued. This left us with 159 arrestees.
We have strong evidence that these 159 individuals include everyone arrested during the operation. Through ground reporting and video evidence available to us we identified several arrested individuals. Each one is in the data with the ‘’NSV GENERAL AREA, NON-SPECIFIC” tag. In addition, we checked the landmark fields for all arrests in Tennessee during this time period and no other arrests plausibly fit the operation.
It is possible that our findings may include a handful of individuals not arrested during the enforcement operation which was carried out between May 3 and May 9 since we include all arrests from May 1 to May 13. In addition, the “NSV GENERAL AREA, NON-SPECIFIC” marker has been used, though quite rarely, before and since the raid. 159 arrested is therefore likely an overcount, which means that DHS’ claim that 196 individuals were arrested is likely false.
But DHS may not only be exaggerating its numbers, it also appears to wrongly include serious criminals in its press releases to advertise the success of its raids. We have confirmed that two people included in the press release were arrested during parole or probation appointments, rather than the enforcement operation.
Who was arrested and what happened to them?
The Deportation Data Project releases contain detailed demographic information on those arrested:
The majority of people arrested were from Latin America with Mexico (46) and Guatemala (44) having the highest number of arrests followed by Honduras (25) Venezuela (10) and El Salvador (7). A small number of people from the Middle East were also arrested with the largest number from Egypt (4), followed by Iraq (1), Jordan (1) and Saudi Arabia (1). The majority of those arrested were men, with 15 women also arrested. The oldest person arrested was born in 1958 and the youngest in 2009. At least one minor was arrested, a Guatemalan boy born in 2009.
Of the 159 arrests, 151 appear in the ICE detentions dataset. Only 40 had any type of criminal record– approximately a quarter of those arrested–with 23 of those being aggravated felons. But as discussed above, several of the people with the most serious criminal offenses highlighted in the DHS press release were not arrested during the enforcement operation. The most common past conviction for those arrested was a DUI (7) followed by Forgery (4).
After people were arrested during the Nashville operation, most only spent a few days in Tennessee before being sent to Louisiana and Texas to be deported. Our analysis shows that 95 people were sent to the Nashville Hold (a temporary ICE holding facility), 46 to the Putnam County Jail and 8 to Knox County Jail. But that was just the beginning of their journey: Most arrestees spent only a few days in various Tennessee detention facilities before being transferred to Louisiana and Texas. As of mid October 2025, 121 of those detained had been deported, 15 had been bonded out of ICE detention, 3 had received an “order of recognizance”, which grants supervised release from immigration detention, and 12 remained in detention. Those with orders of recognizance were released while still in Nashville. Everybody who was bonded out had already been transferred to Louisiana.
Open Source Research and Findings
We conducted open source investigative analysis into the May 2025 operation in Nashville. Our sources of evidence primarily consist of images, videos, and posts published online to social media channels as well as Tennessee Highway Patrol dashcam and bodycam footage of arrests obtained through FOIA requests and provided to the investigative partnership by the Tennessee Immigrant and Refugee Rights Coalition (TIRRC).
Body/Dashcam Footage
The videos we received from TIRRC cover the first day of the Nashville operation. The records included 250 videos consisting of bodycam and dashcam footage recorded between the evening of May 3, 2025, (8:42 PM) and the early morning of May 4, 2025 (3:13 AM). In total this represents more than 50 hours of footage of the traffic stops and arrests made during the operation. Across all of the videos, we geolocated the footage.
The footage contains 137 unique stops (some stops had multiple camera feeds). In 13 cases, the drivers were stopped for an apparent traffic violation, but their licences were not run in the law enforcement system, nor did THP officers even ask drivers for their licenses, after apparently assessing without proof that mostly white or African American drivers were citizens. In at least 7 cases, troopers signaled to ICE if they felt certain that the stopped driver would be of no interest to ICE. In one case, a driver was pulled over for a bent license plate and then, after running his license, the officer fixed it for him and let him go. In 4 additional cases, cars without proper documents or drivers without valid licenses were let go. (In 61 cases, drivers were let go after an apparent traffic violation and running their license, without a penalty.)
At the same time, in many cases where a driver’s license was from outside the U.S. or the individual did not have a license and produced a passport, the officer handed the documents directly to the ICE officer before running them.
Cross referencing with arrest data
From Tennessee highway patrol incident reports, we were able to extract approximately 604 traffic stops. While much of the information in these reports is redacted, we can track the routes of individual Tennessee Highway Patrol units during the enforcement operation. We were able to match 25 cases from the Body/Dashcam footage to data in the Tennessee Highway Patrol arrest records. This allowed us to map out the trajectory from stop to detention to deportation in those several cases.
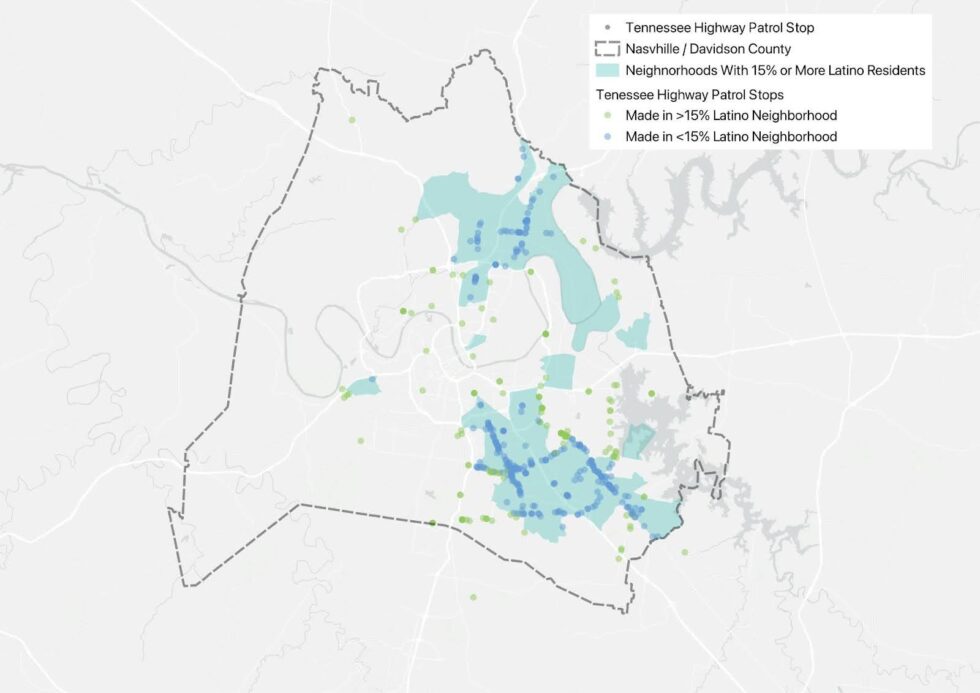
We mapped our location data derived from the Tennessee Highway Patrol stop data, body/dashcam footage, and open source media against demographic data from the 2024 American Community Survey’s Table B03002, which tracks populations of Hispanic or Latino origin across the country. We calculated the percentage of Latino residents per census block by dividing the total number of Latino residents by the total number of residents per census block. 399/602 stops (approximately 60%) took place in neighborhoods with 15% or more Latino residents. Latinos are concentrated in South Nashville and Northeast Nashville.
Open Source Media
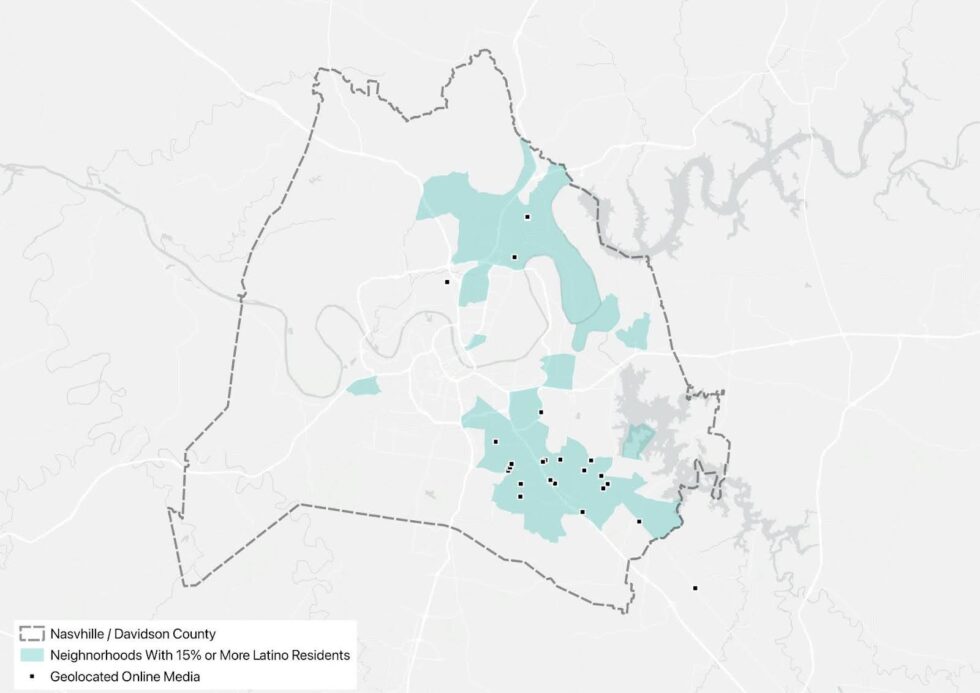
In addition to official records, we conducted a review of open-source media, archiving more than 40 publicly posted photos and videos documenting apparent ICE activity in the Nashville area. This material was shared online by local residents and activist groups. While these files are not suitable for quantitative analysis, the locations are broadly consistent with Tennessee Highway Patrol stop data, with nearly all incidents clustering in Southeast Nashville. This archive provides valuable on-the-ground documentation of enforcement activity and serves as an important qualitative reference alongside administrative data.
Analyzing individual arrests across data sources
To date, the Tennessee Highway Patrol and ICE have never released information on who they arrested and what happened to the people detained. Since the ICE deportation data is anonymized, we faced the challenge of identifying people who were arrested during the Nashville dragnet. We were able to uniquely match every individual for whom we had a country of origin, age, and criminal background in the DDP data. The data helped us to reconstruct and tell individual stories of people stopped and detained by ICE, following them from the exact moment of arrest, through what often amounts to a chain of detention centers, and onto deportation flights.
From the perspective of the various datasets, the arrest of Edgardo Campos, a 55 year old originally from El Salvador, looks as follows: We see him in the Highway Patrol data when he was stopped at a MAPCO fuel station on 311 Harding place. Bystanders document his arrest. According to the arrests dataset, ICE arrested him at 3:48 a.m.on May 10th. He is marked as an aggravated felon for “Fraud – Impersonating”. Court records show that this conviction was for using a fake ID (often a precondition for undocumented people who seek to work).
After being held in Putnam County Jail from May 10-13, Campos was transferred to Knox County Detention Facility from May 13-16, before being sent to Jackson Parish Correctional Center, LA. He was deported on June 13 to El Salvador after more than 20 years in the United States.
Data Processing
Deportation Data Project
Minimal preprocessing on the Deportation Database Project (DDP) releases was required. Primarily, preprocessing focused on implementing DDP’s suggestions to remove likely duplicates:
● Arrests: remove arrest records for individuals who were arrested less than 24 hours previously.
● Detainers: kept a single record with a unique ID, detainer date, and detainer lift reason.
● Encounters: kept a single record for unique ID and encounter date.
● Detentions: kept a single record for each unique ID, book in date/time, and facility.
● Removals: kept a single record for each unique ID and removed date.
Columns that were always empty or redacted were removed. In addition, columns indicating association with the 287(g) program and an indicator variable for the beginning of the second Trump administration (after Jan 20 2025) were added. For the detentions dataset, a version which only contains the first detention facility per detention stay was created.
The biggest limitations of the database is its lack of personally identifiable information and the absence of detailed (geographic and agency-related) information about arrests. To identify individuals who we know to have been arrested, we used year of birth, citizenship, and criminal record. With two or three demographic data points about an individual, a rough timeframe of the arrest and its approximate location, we always get a unique match, allowing us to trace individuals through the deportation pipeline.
The arrest data also does not contain detailed geographic information, but we can figure out where people were picked up through columns indicating AOR and state of arrest. In addition, there is a free text “landmark” field that, depending on time and geography, often provides information on the jail people were picked up at or information about the ICE field office responsible. In addition, we can infer where people were arrested based on their first ICE detention location, under the assumption that it is proximate to the location of their arrest.
TN Highway Patrol Incident reports
We split Tennessee Highway Patrol incident reports into single reports, then uploaded them to Pinpoint and used their structured data extraction tool to generate a CSV file. In total we extracted structured data for 605 reports. The Pinpoint tool is not perfect: especially the Event Log boxes were incompletely scraped. Mistakes appear to be rare but we have not manually confirmed that every field was properly scraped (since we used quite few of them).
We used Google Map’s single address geocoder to geolocate all the addresses in the dataset, which worked for all but 1 of the addresses. Finally we used a regex string processing to extract the “primary unit responsible”, i.e., the police car.