
10.10.2023
The West’s Next Plastics Dump
As Southeast Asia bans plastic waste imports, rich countries are offloading their plastic waste in even more vulnerable places – where citizens are too afraid to say no.
Published with

INVESTIGATION
Our latest investigation into the global plastic waste trade uncovered dumping by wealthy countries in one of the world’s most troubled and repressive states.
After China, the world’s largest importer of plastic waste, stopped imports in 2018, massive waste flows were diverted to Southeast Asia. But after public protests, Thailand and other countries in the region have promised to ban imports as well.
We wanted to understand whether Thailand’s ban would just divert foreign plastic waste once again, and this time to even more vulnerable countries. In neighbouring Myanmar, people have little ability to protest. Since the junta seized power in a coup in 2021, all public dissent has been quashed.
Using international and national trade, customs and shipping data, combined with extensive on-the-ground reporting, we began by looking at the current status of plastic waste flows into Myanmar – and discovered a major loophole in Thailand’s ban.
Here are some of the roadblocks we encountered, and workarounds we found, that may be useful for other journalists and researchers investigating the opaque and complex global plastic waste trade.
A. UN Comtrade
The United Nations has a platform for trade data called UN Comtrade, to which countries submit their national figures. Although the data is not verified nor cross-referenced, and has major gaps, Comtrade is still a good place to start as it broadly captures overall trends in most cases. You can filter and extract data using multiple parameters, such as by time period or countries of import and export.
Tip: Create an account to speed up searches and download data.
The first step is to look up the HS Commodity Code of the good you are interested in here. Harmonized System (HS) Codes are administrated by the World Customs Organization and used by most of the world’s custom authorities.
The HS Code for plastic waste is 3915. You can search for all types of plastic waste using this four-digit code, or further narrow down your search by using a longer six-digit subcode. For example, 391510 is polyethylene (PE) waste, 391520 is polystyrene (PS) waste and so on.
Tip: If you see a commodity code that is longer than six digits, the rest of the numbers are not part of the international harmonized system, but have been added by national customs authorities. For example, the US differentiates between 39159010 polyethylene terephthalate (PET) and 39159090, other types of plastics.
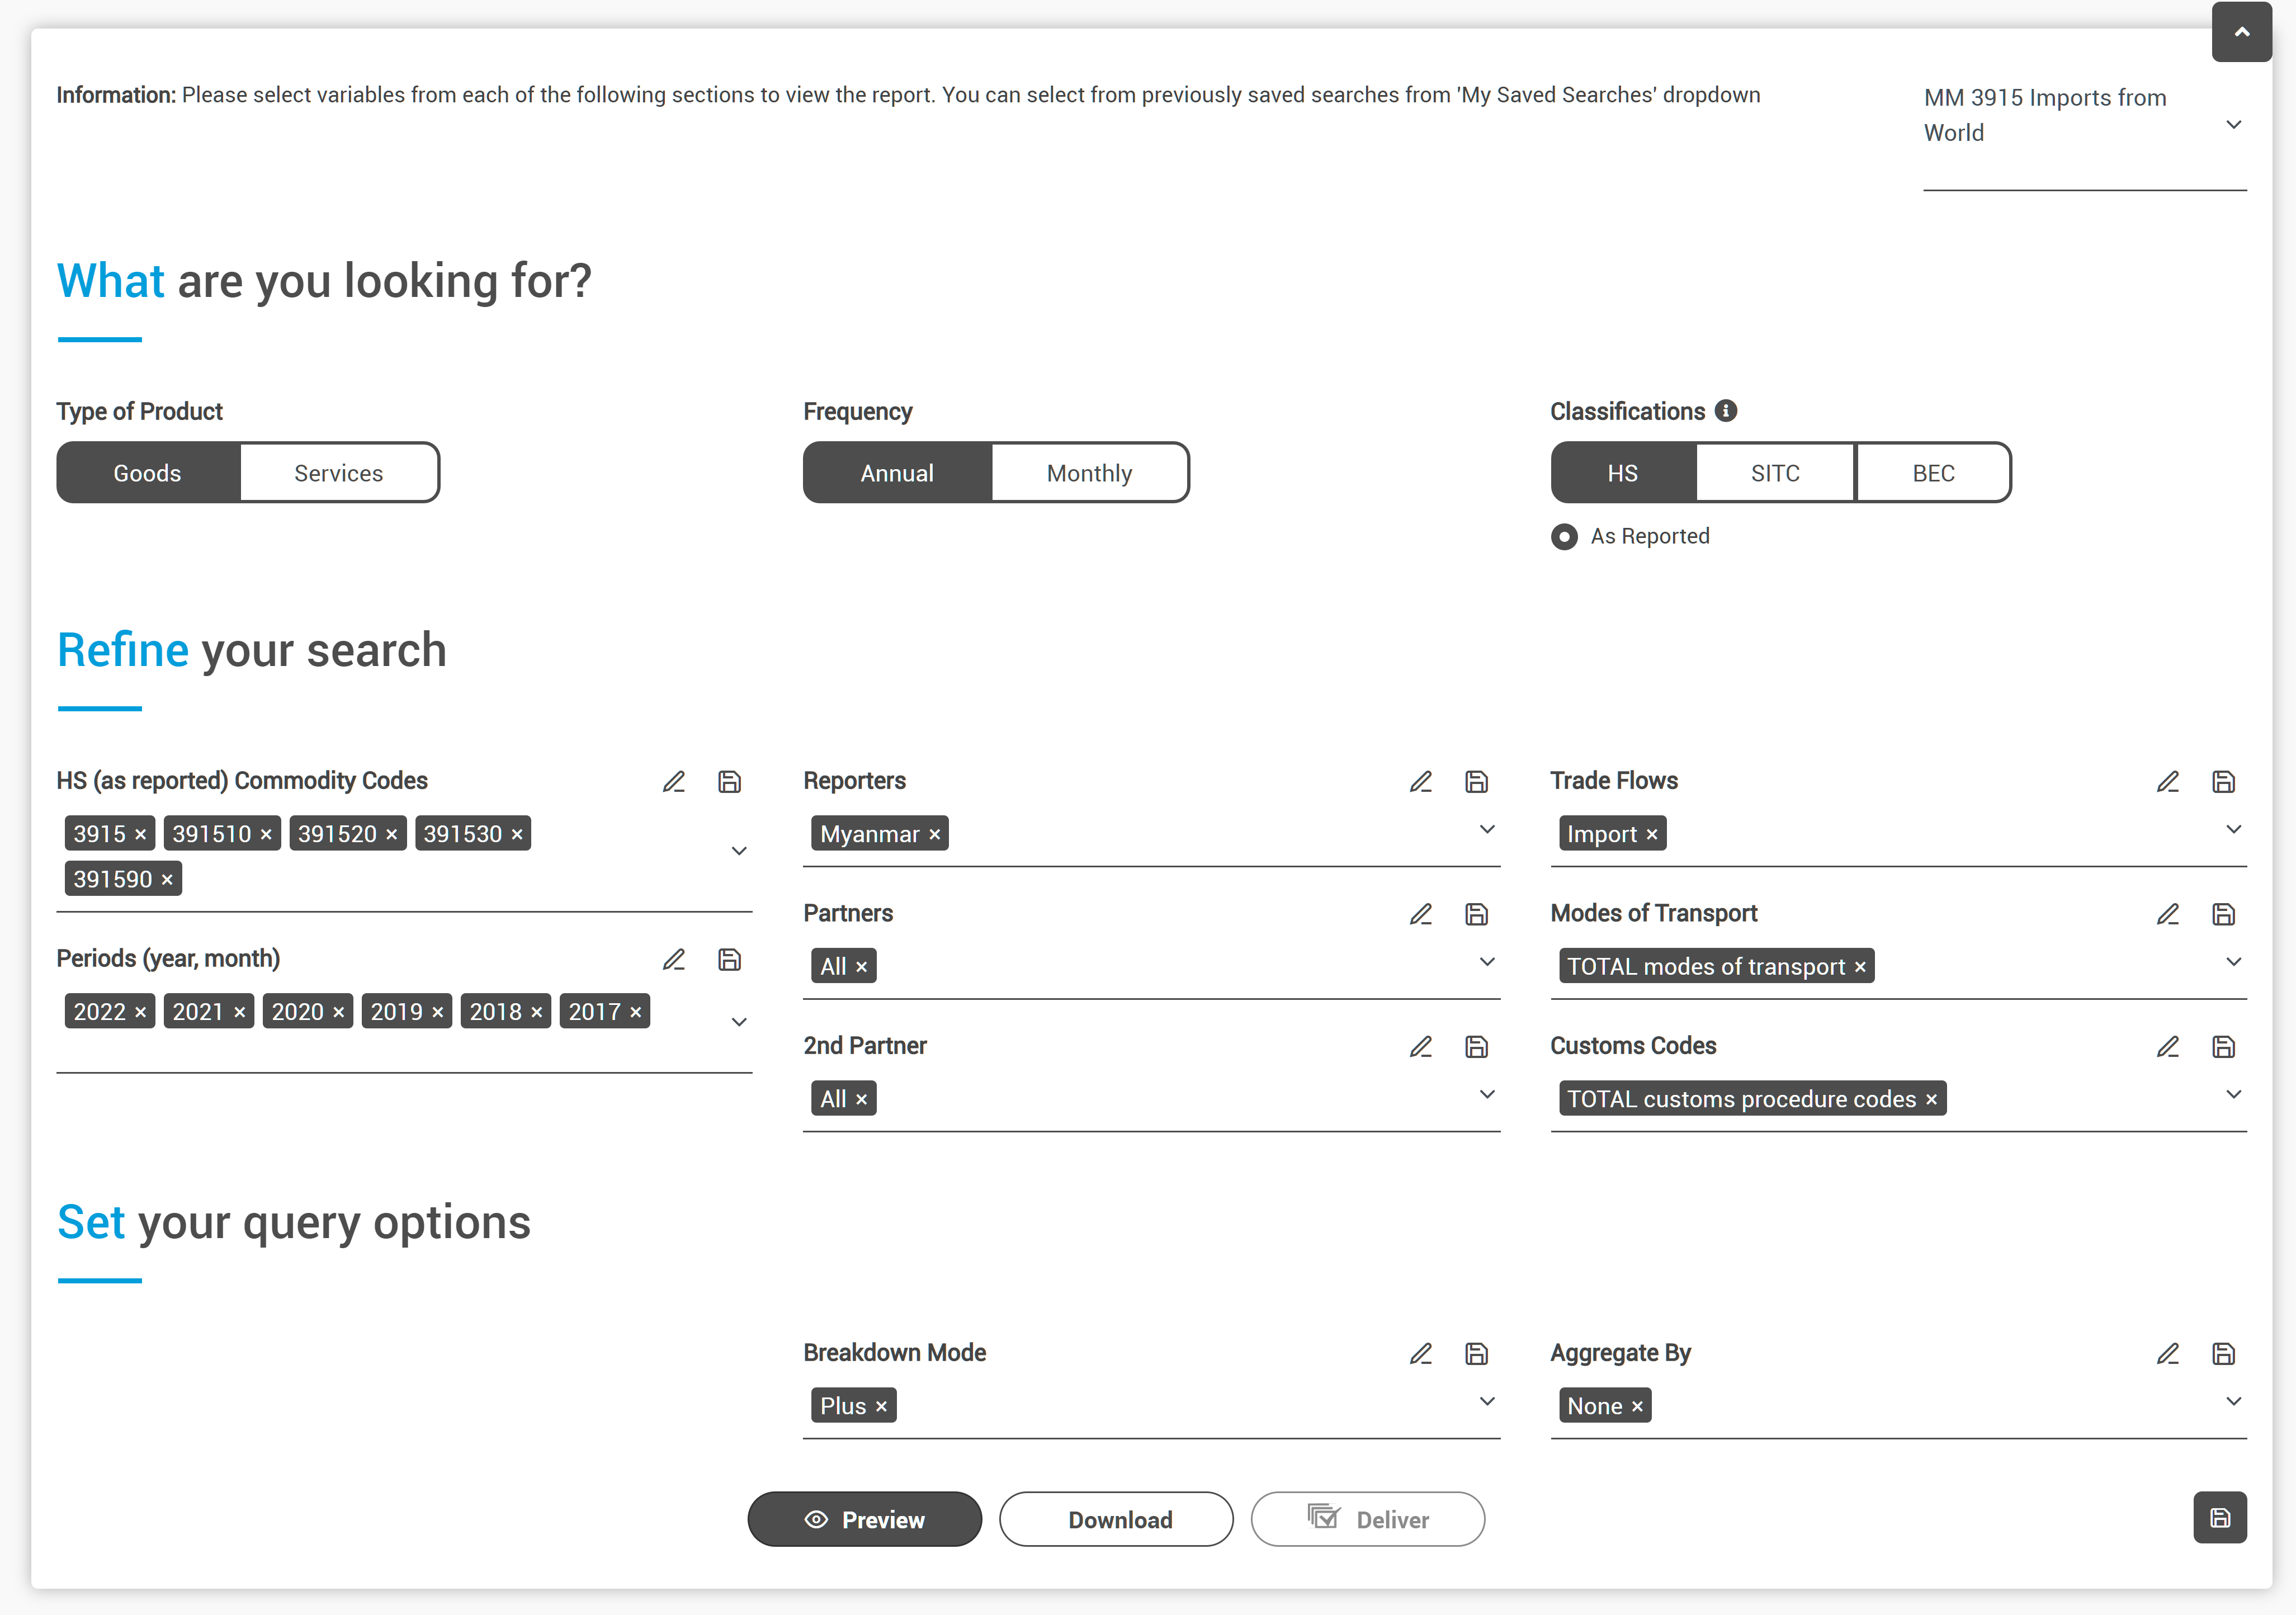
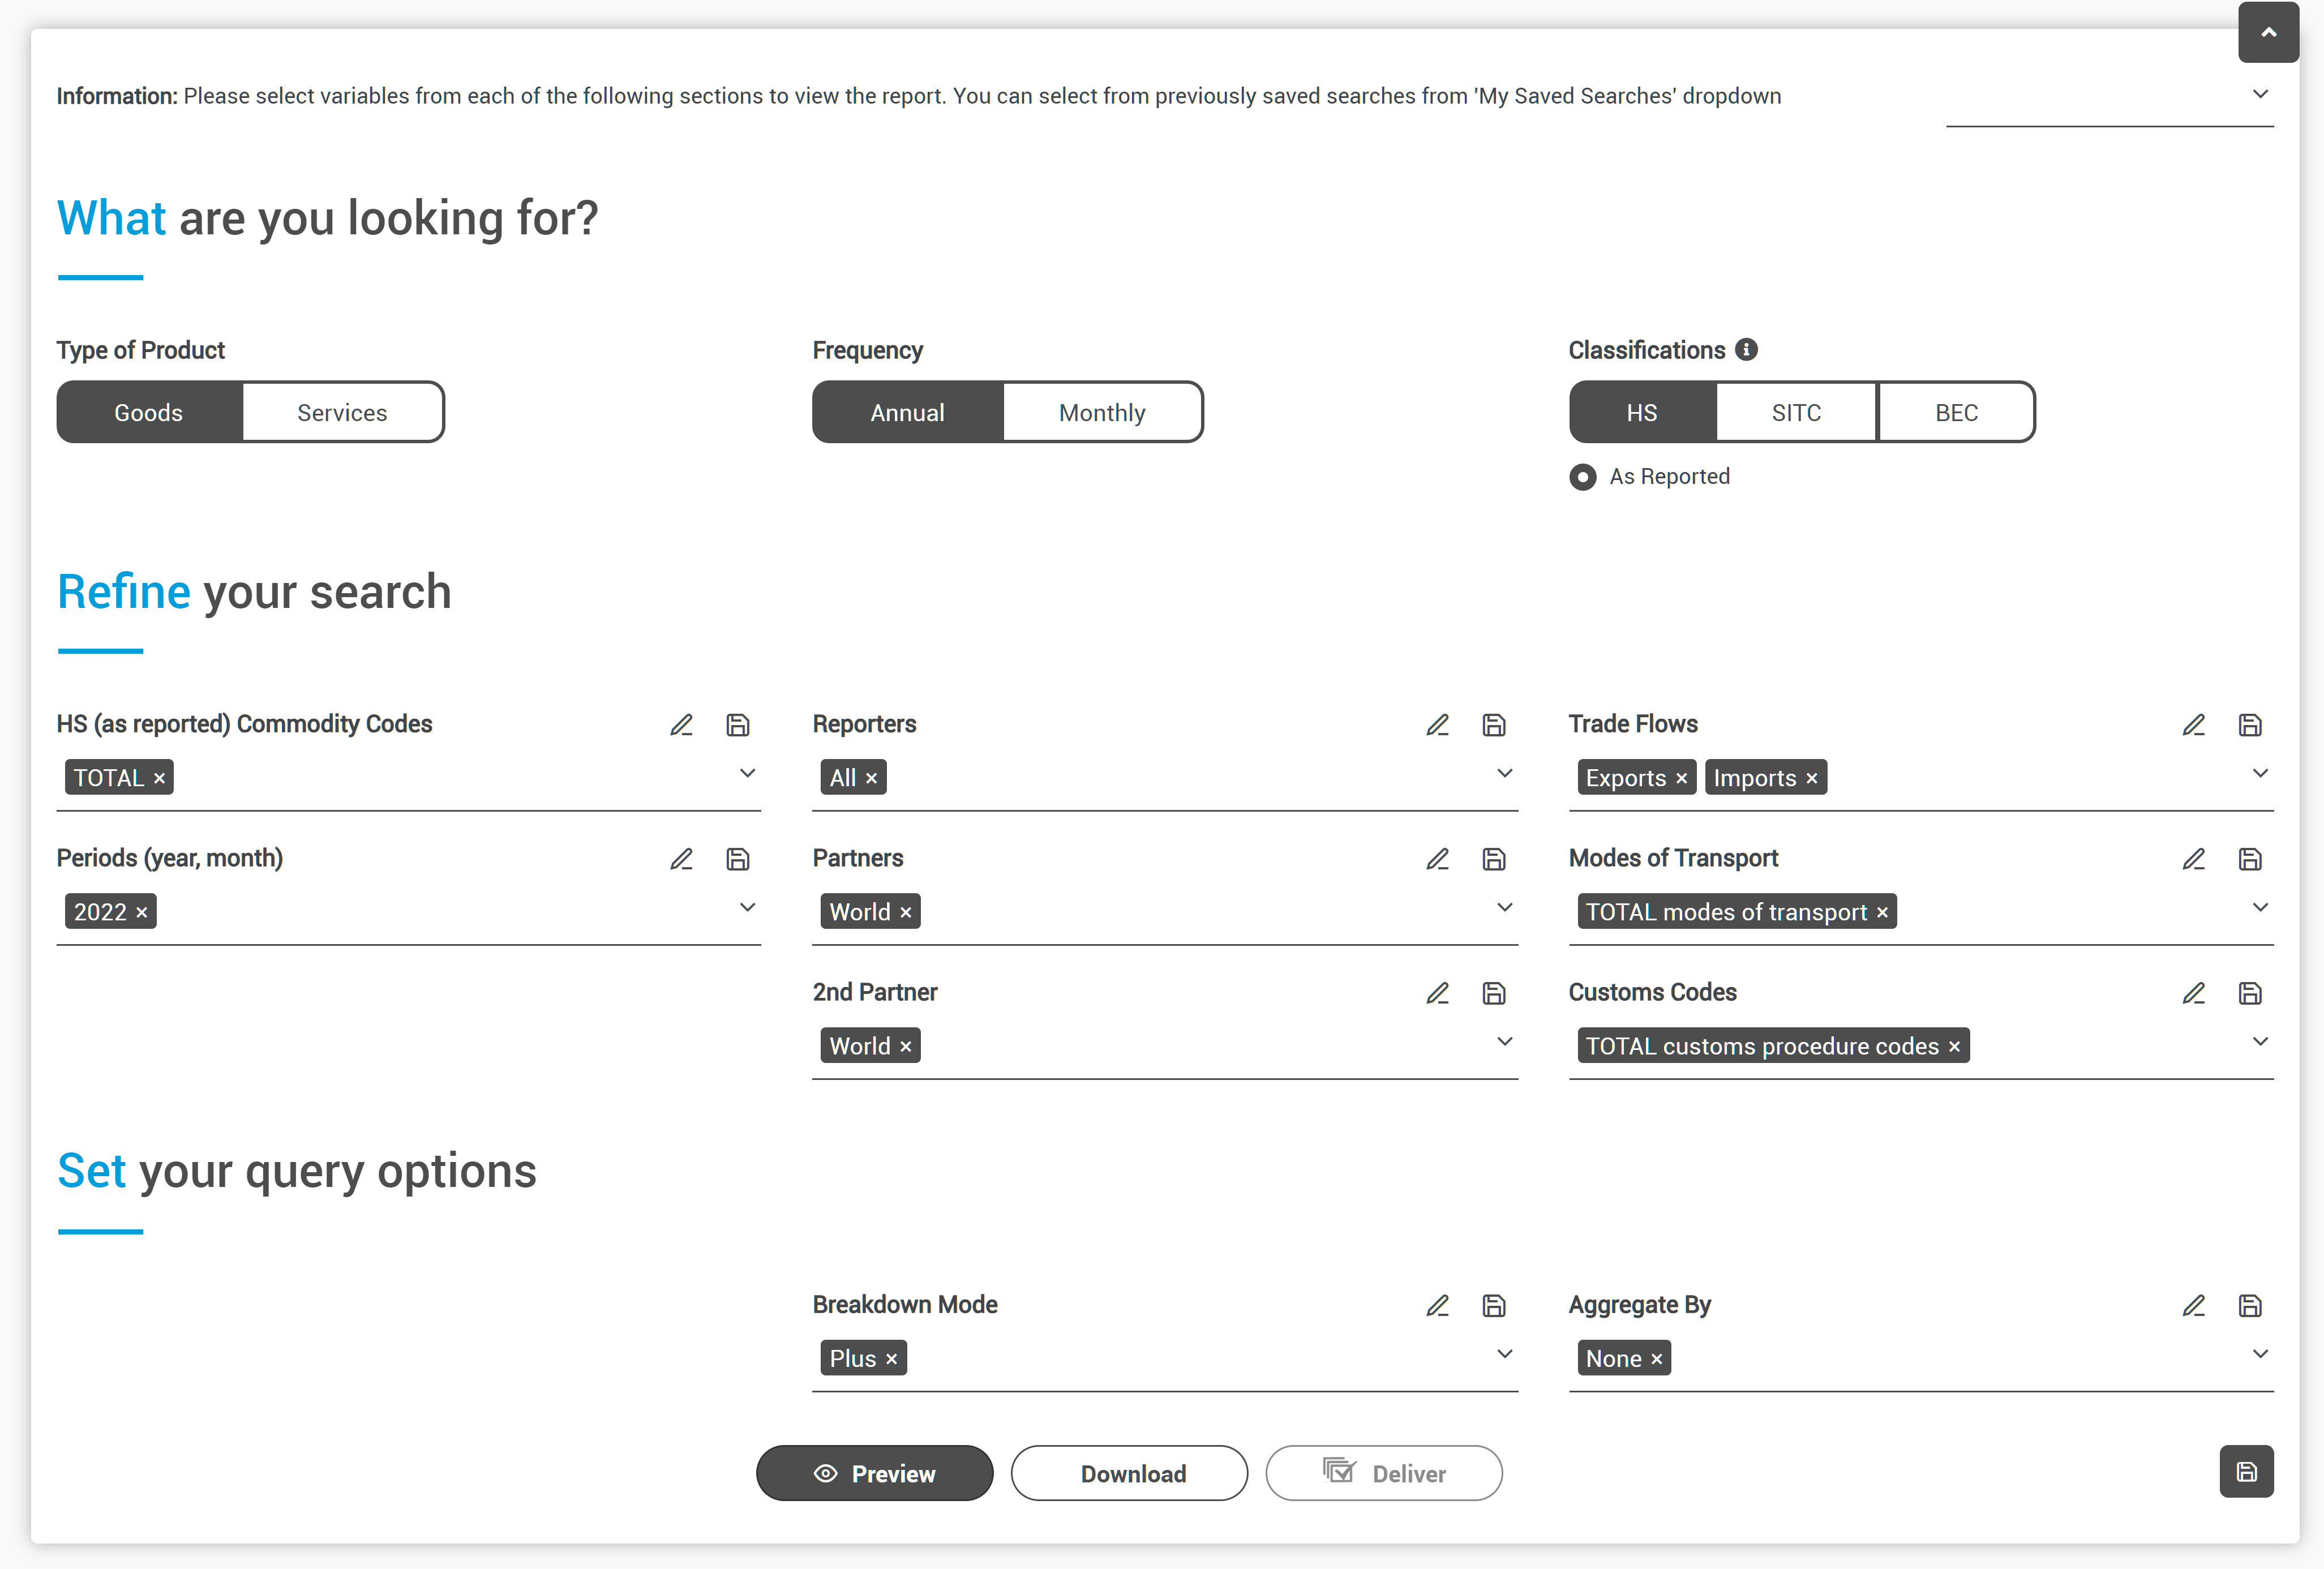
In most cases, you will want to check both what the exporting countries say they are sending and what the importing countries say they are receiving in case of any discrepancies. To do this, you change the reporters, partners and trade flow. For example, Figure 2 shows how to get the data on global imports of plastic waste reported by Myanmar, and figure 3 shows the same trade, but reported by the exporting countries instead of Myanmar.

Tip: Besides the importer and exporter, if the goods are bought by a broker in a third country (for example to import goods into a country with no seaport) this country should technically be listed as “2nd partner” in Comtrade. This can be useful if you’re trying to track the route of a good through multiple countries. However, this is not mandatory and the field was not used at all for European exports of plastic waste to Myanmar via Thailand.
B. Thailand’s Plastic Intelligence Unit
It’s worth looking at what national datasets are available as well as what is reported to UN Comtrade, in case more detailed data is available or it shows interesting discrepancies with Comtrade.
Myanmar does not publish detailed trade data, but Thailand has a data hub called the Plastic Intelligence Unit (PIU) which is maintained by the Thai customs department. It contains price and trade data for plastics including plastic waste. You have to set up a free account to access their data.
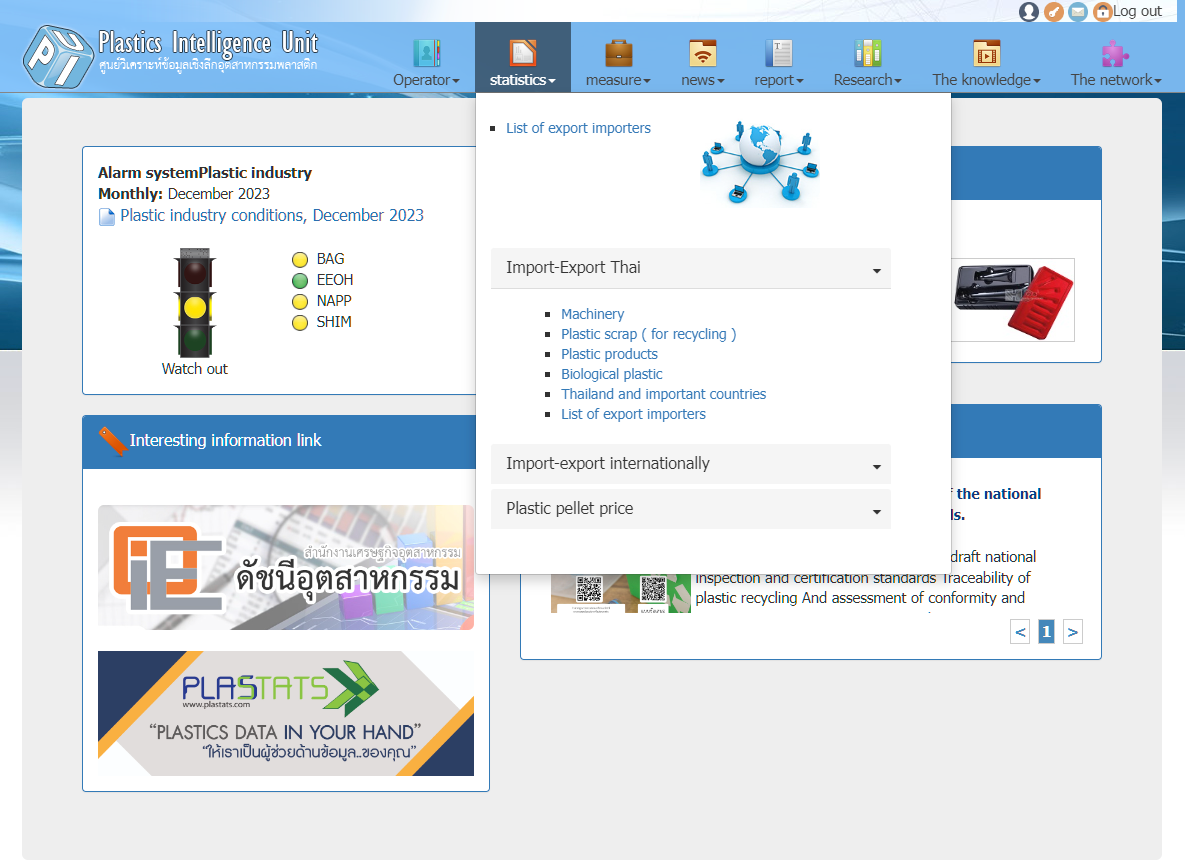
You can filter for monthly, quarterly or annual data, which can be extracted one year at a time.
Tip: Double check strange numbers with a source. We initially found significant discrepancies between PIU and UN Comtrade data, but after speaking with a PIU data analyst we found that only the monthly figures were inaccurate and the yearly aggregated figures were comparable to UN Comtrade.
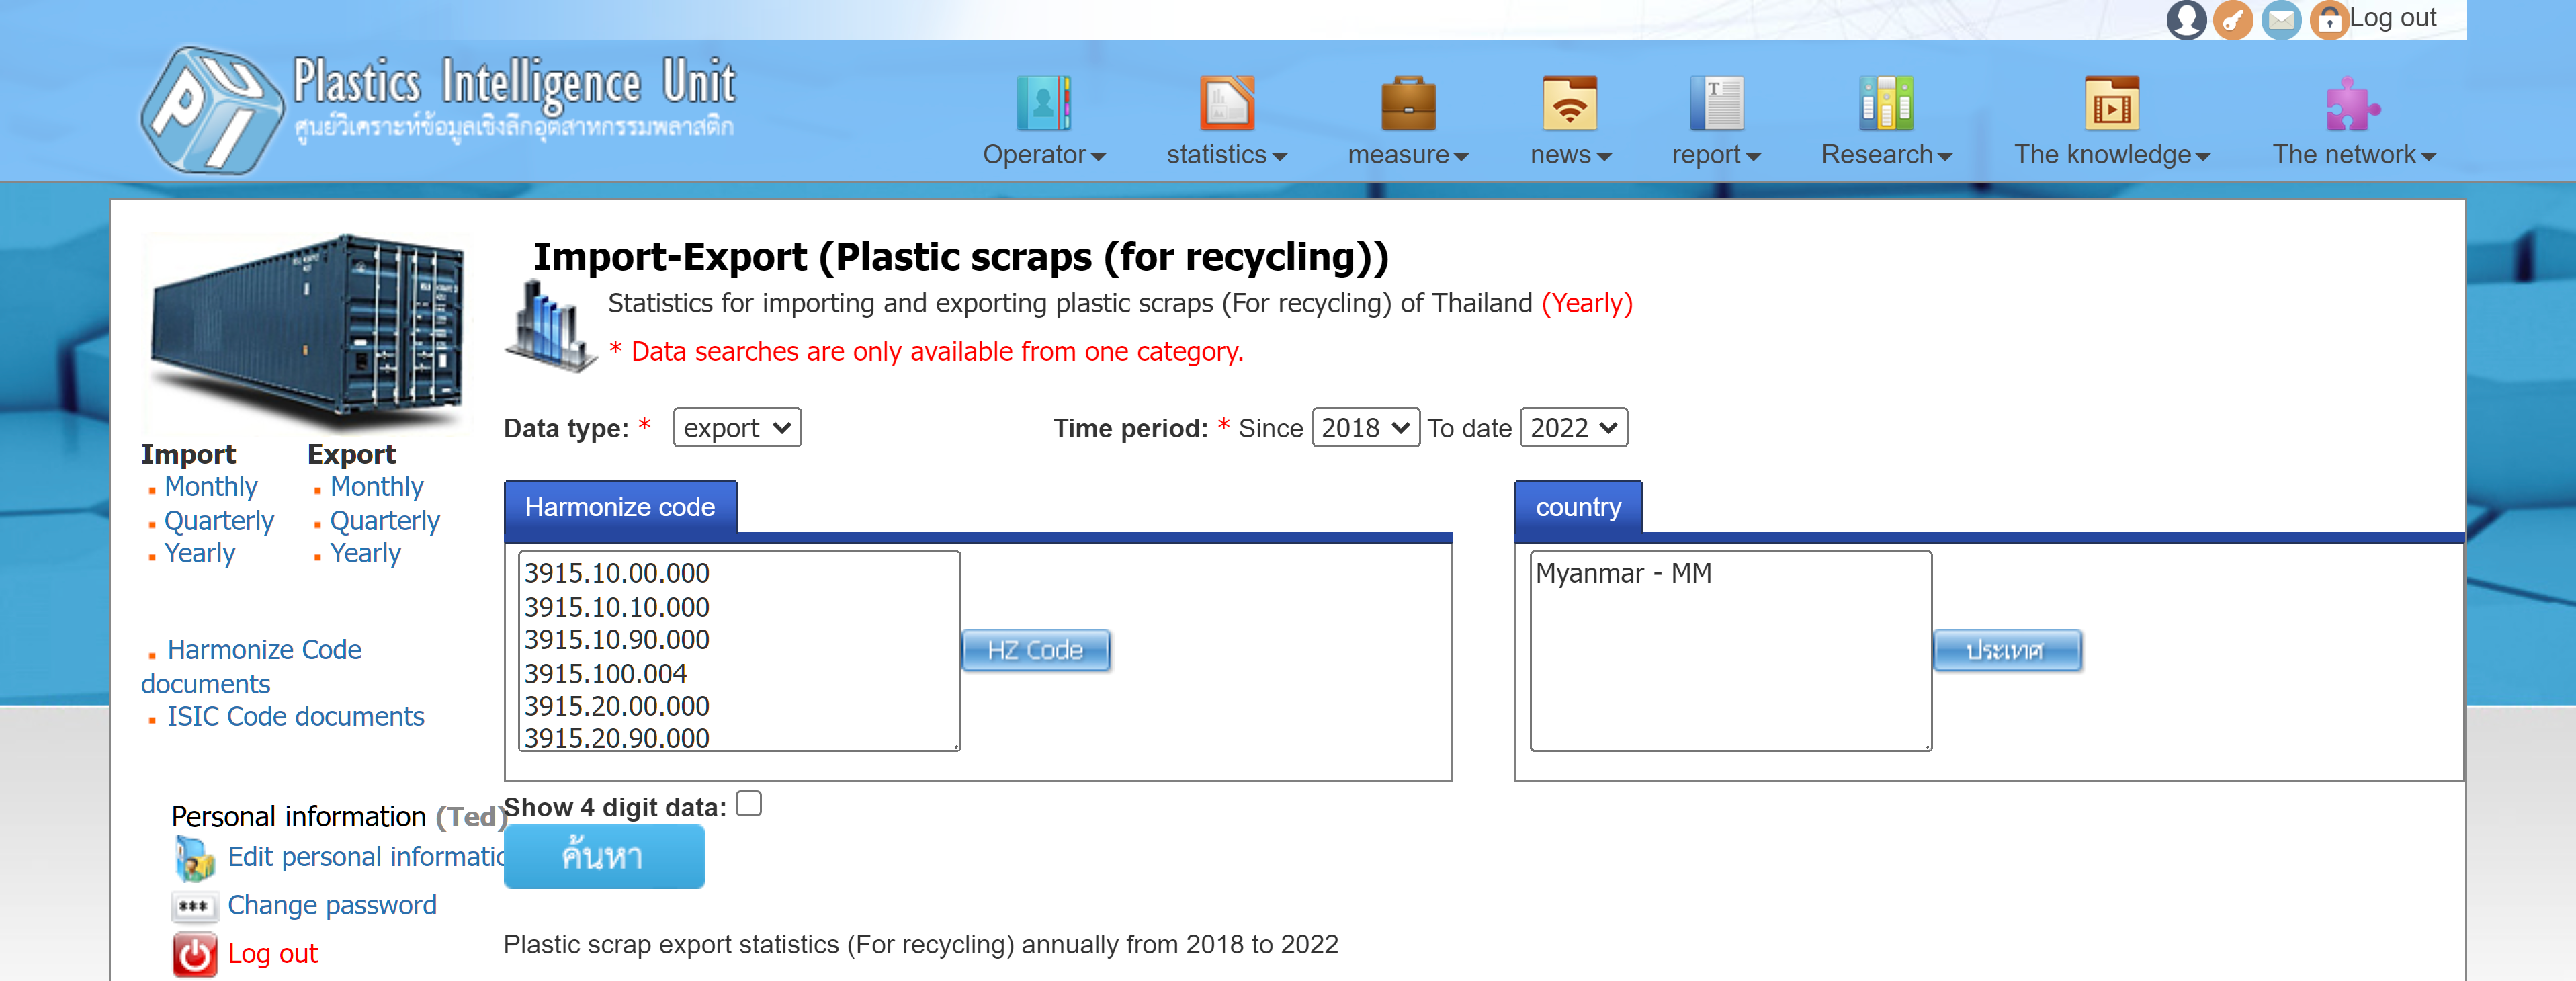
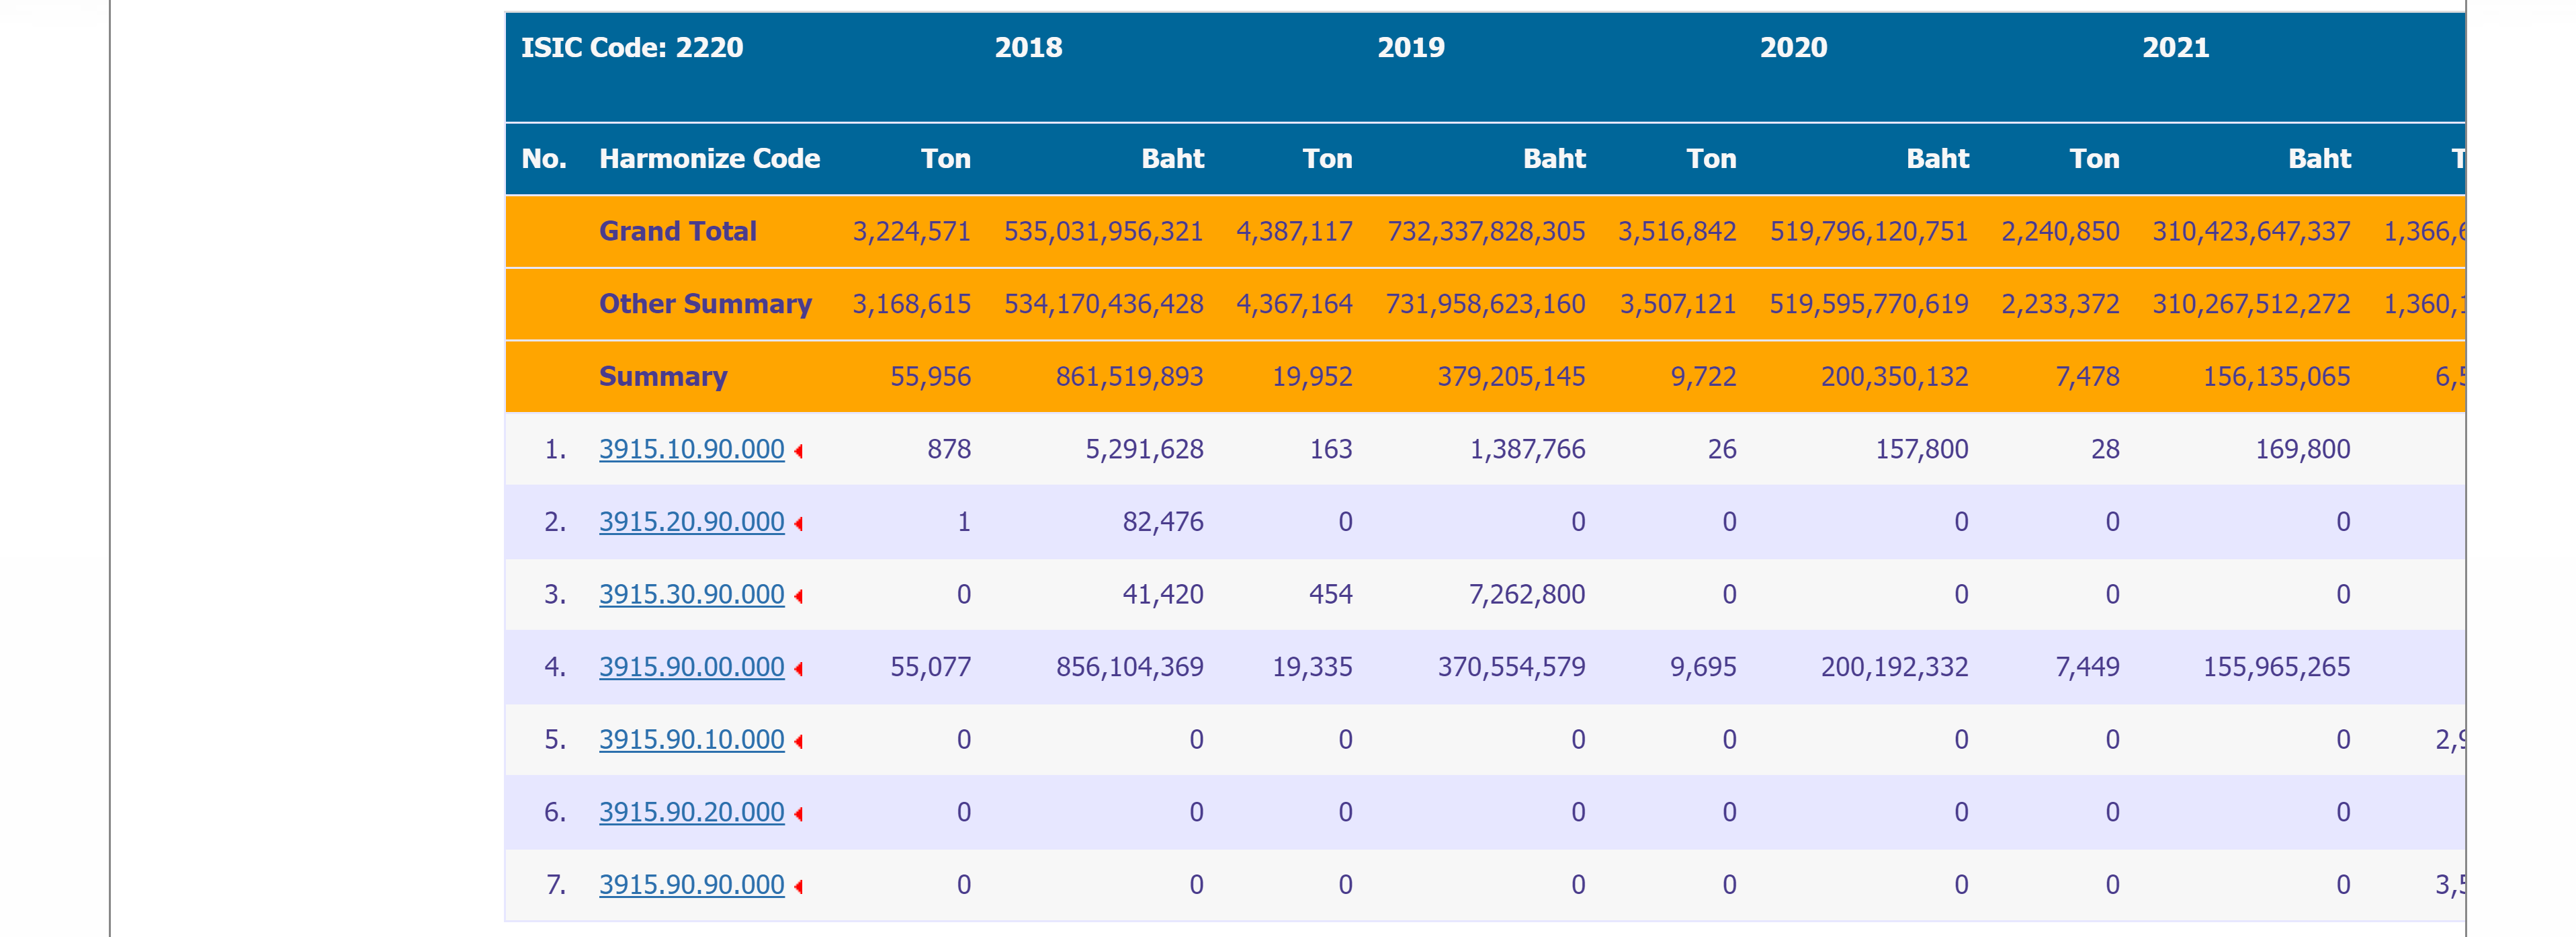
PIU includes all the subcodes used by Thai customs authorities in addition to the international HS Codes. The “summary” row is the total value for 3915.
The Plastic Intelligence Unit also had another useful dataset – a list of the companies that have imported or exported plastic waste to and from Thailand. You can search by year and by subcode (for example, 391590 which is PP plastic). A search for Thai exporters of PP from 2019-2022 returned the names and contact details of 254 companies. We then further filtered the data for companies located near the border with Myanmar. This was a useful starting point for reporters to start interviewing people who may be sending plastic waste to Myanmar.
The dataset extracted from UN Comtrade may contain up to 47 columns depending on the setting used to download the data. Before analysis, it is important to pay attention to the following columns to avoid duplicates:
– Partner2Desc: Select “2nd Partner” = “All” if you are interested in other countries involved in the trade, but then you will need to remove “World” to deduplicate the data. If this field is not relevant to your search, just select “2nd Partner” = “World” for the aggregate data.
– CmdCode: If you are interested in the subcategories of plastic waste and downloaded the data for the six-digit codes (391510, 391520 etc) just remove the four-digit 3915 code to deduplicate. If you don’t need to see the subcategories, just select “3915” for the aggregate data.
– MotDesc & CustomsDesc: If you are interested in how the goods arrived (land, sea etc.) or the specific customs procedures you can select “All” for “Customs Code” and “Mode of Transports,” just remove “Total MOT” or “Total CPC” to deduplicate the data. If these are not relevant, just use the “Total” filter for the aggregate values.

Having extracted data on exports to Myanmar from UN Comtrade using the parameters shown in figure 7, we pivoted the source data with:
– Row = “ReporterDesc”
– Column = “RefYear”
– Value = “NetWgt”
– Filters = (“Partner2Desc” = “World”) AND (“CmdCode” = “3915”)
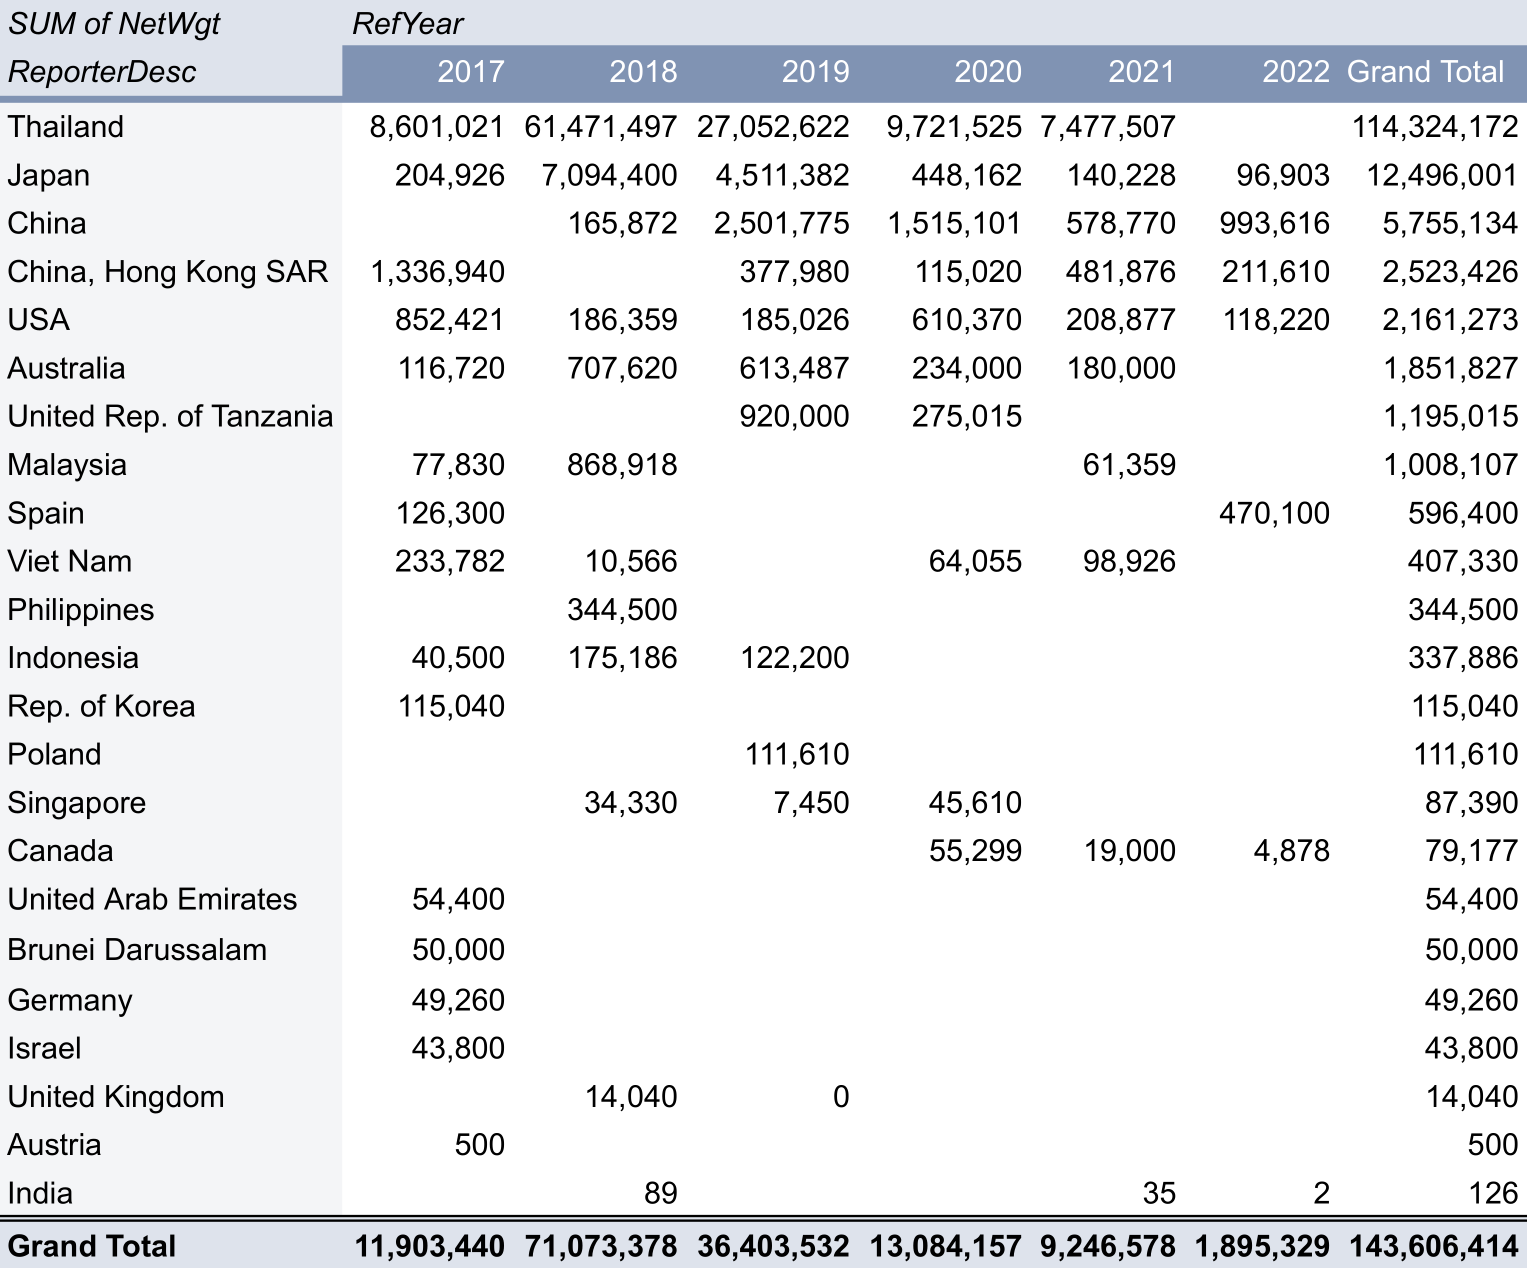
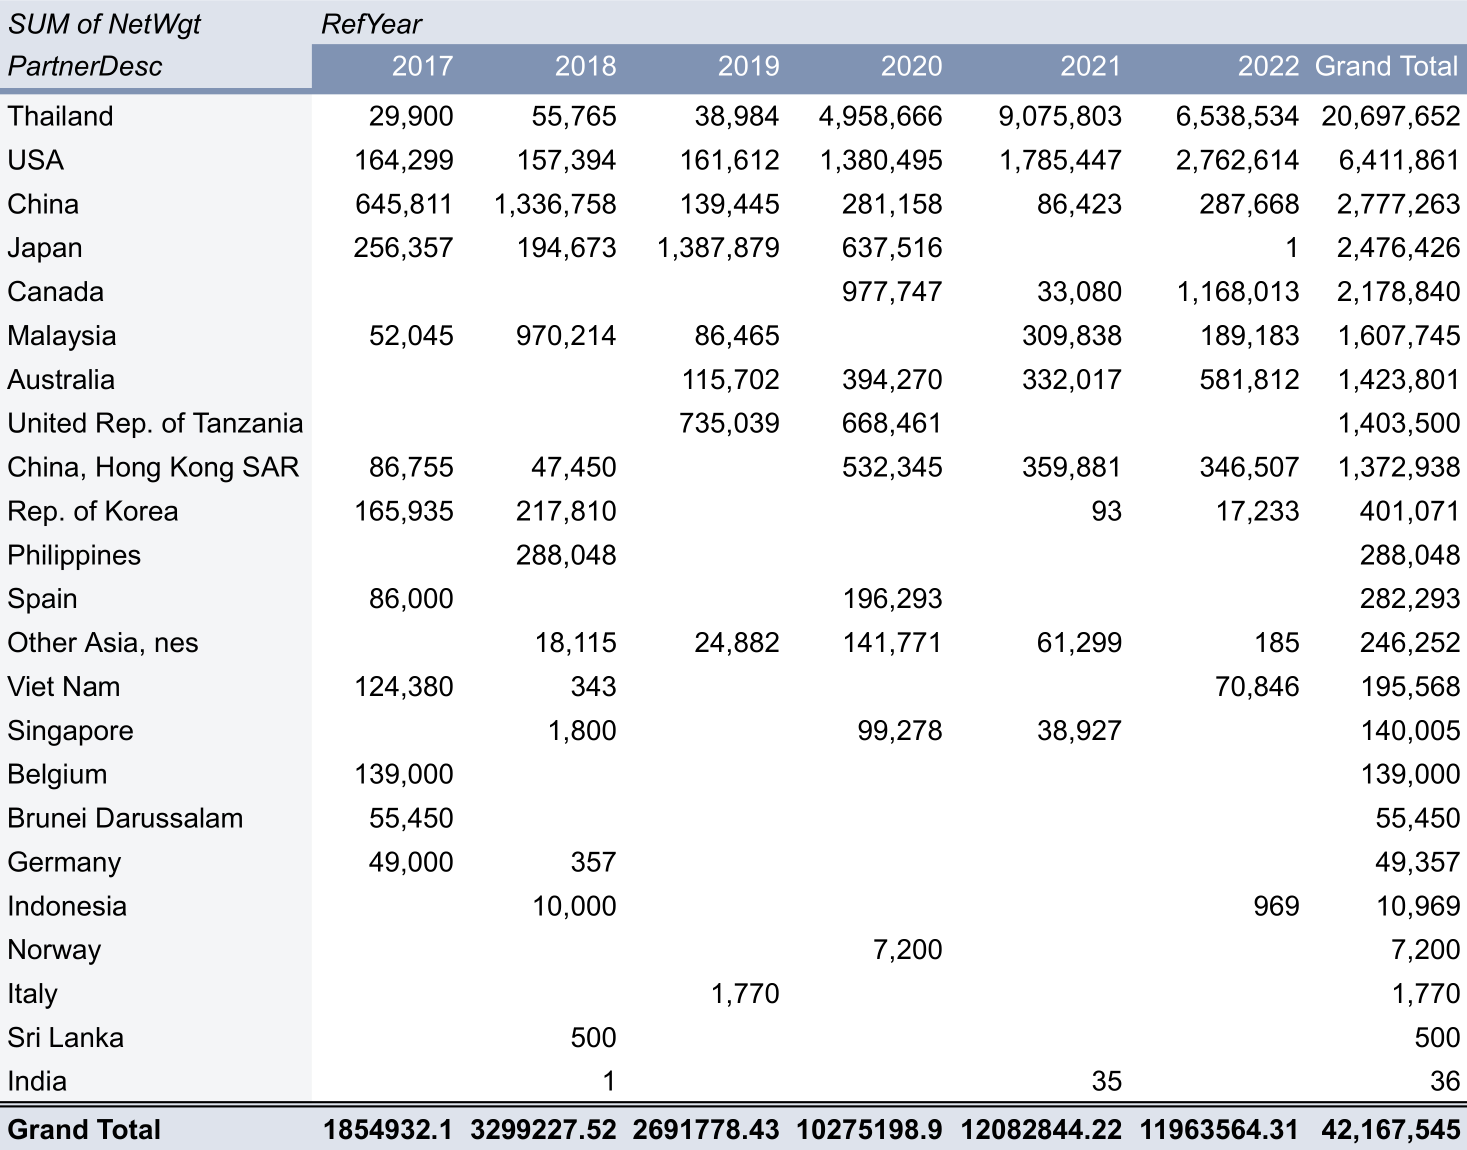
We then extracted the same data as reported by Myanmar (table 3). This enabled us to run two types of analysis:
– Examine broad trends. Despite the limitations to the data, calculating the net weight and value of plastic waste imports and exports does reveal some consistent patterns. For example, the top three countries exporting 3915 to Myanmar are the same in both their export data and Myanmar’s import data. reporting 3915 exports to Myanmar.
– Identify significant discrepancies. For example, there were 23 countries in the data but only 18 countries appear in both Myanmar and the exporters’ data, while five appear in only one or the other.
Tip: When analysing trade flows, use weight not price. Like many commodities, the price of plastic and plastic waste fluctuates as these markets are highly speculative. Large differences in values may not necessarily mean large differences in amounts.
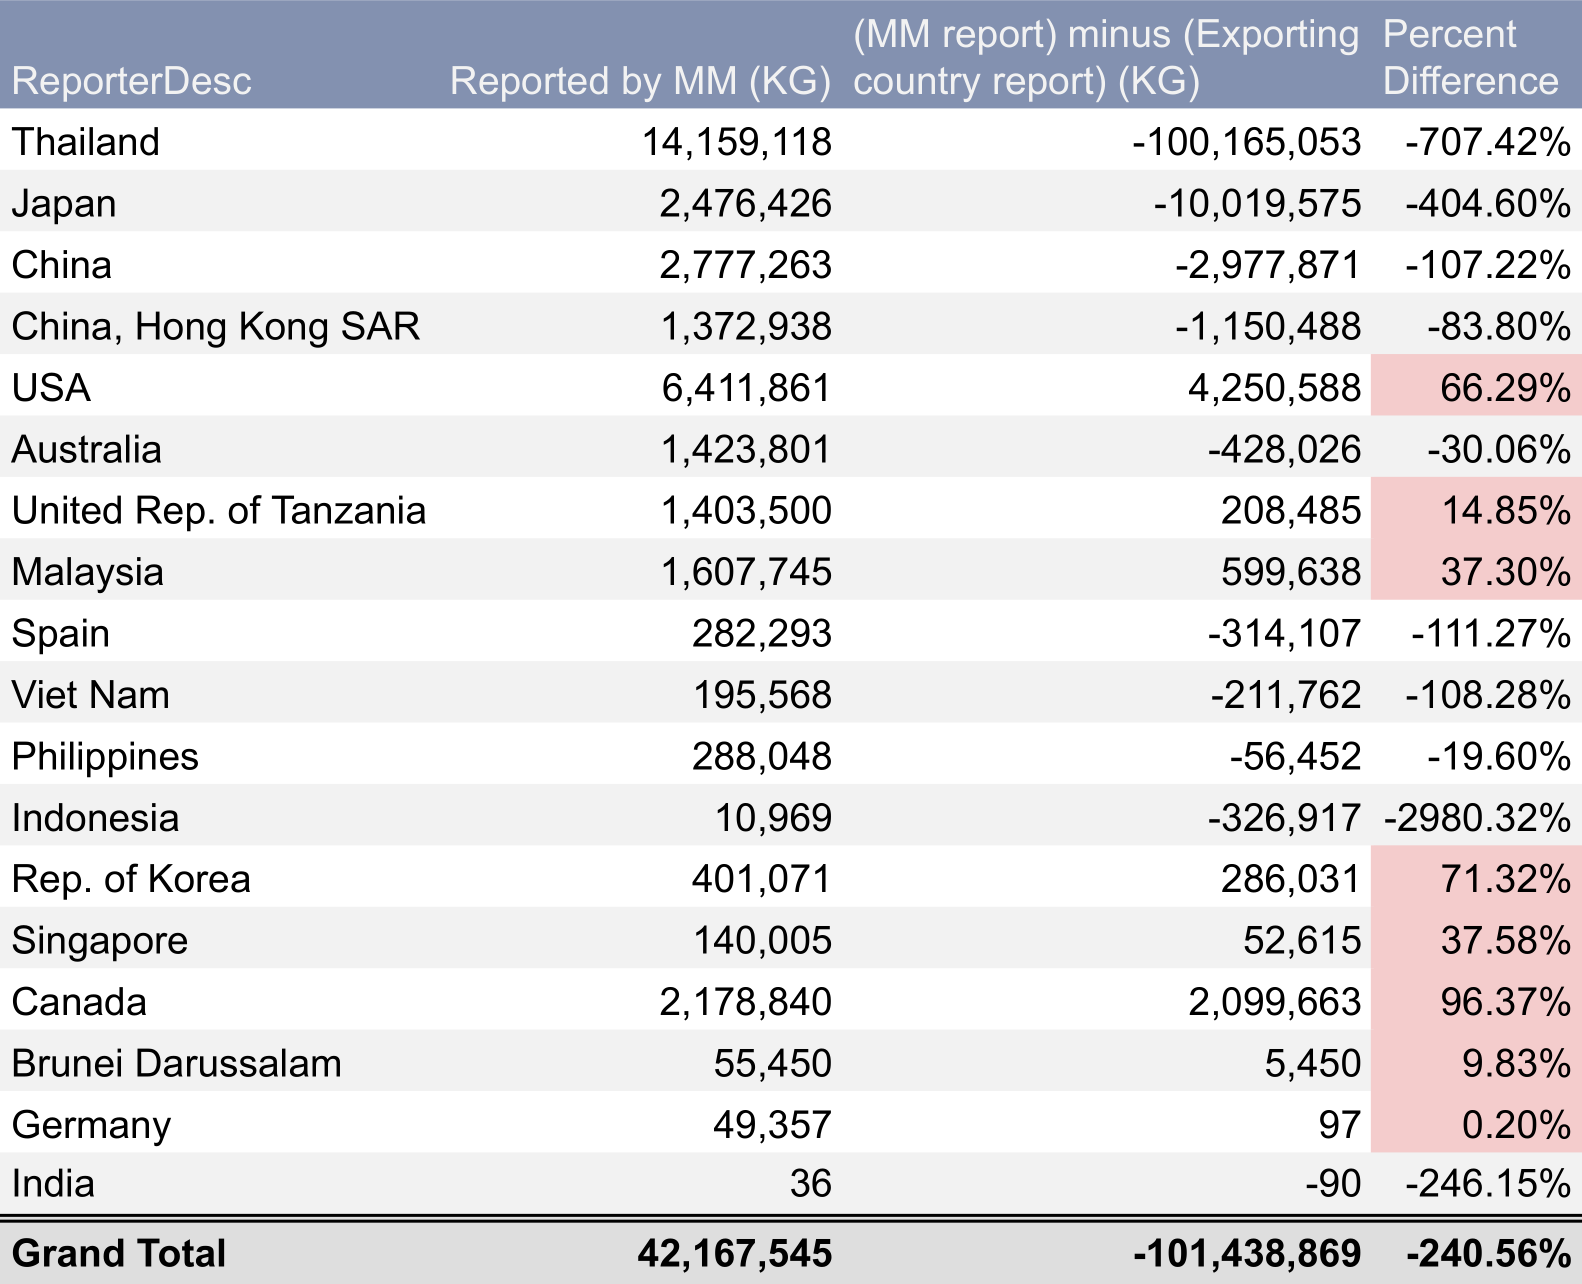
We then calculated the percentage difference between Myanmar and the exporters’ data (Table 4).
Notably, Myanmar is vastly underreporting imports of plastic waste from some countries, compared to exporters’ figures. For example, Thailand reports that it has exported seven times the amount of plastic that Myanmar says it has imported from Thailand.
Myanmar officials acknowledge that this type of underreporting could indicate large scale smuggling at Thailand’s porous border with Myanmar. Our reporting at the border indicates that Thailand is recording plastic waste leaving the country but it is never officially recorded on the Myanmar side.

In other cases, it is the exporters who are underreporting. For example, between 2017 and 2022, Canada reports that the net weight of its plastic waste exports to Myanmar is nearly 30 times less than Myanmar’s reported figure. Canadian officials did not respond to requests for clarification.
Tip: Be careful with data from the most recent year available when making multi-year comparisons or using aggregate totals. There is no set timetable for countries to send data to Comtrade and they are often late in reporting. For example, several countries have not yet reported their 2022 plastic waste exports to Myanmar, including Thailand which is by far the largest exporter to the country.
Every shipping container in the world has a unique number, assigned by the Bureau of International Containers (BIC). These container codes are used by companies to track their shipments as they move around the globe. If you find a container of interest, for example illegally shipped plastic waste that has been seized by customs authorities or suspect shipments by companies relevant to your investigation, you may be able to track their origin and destination using the container code.
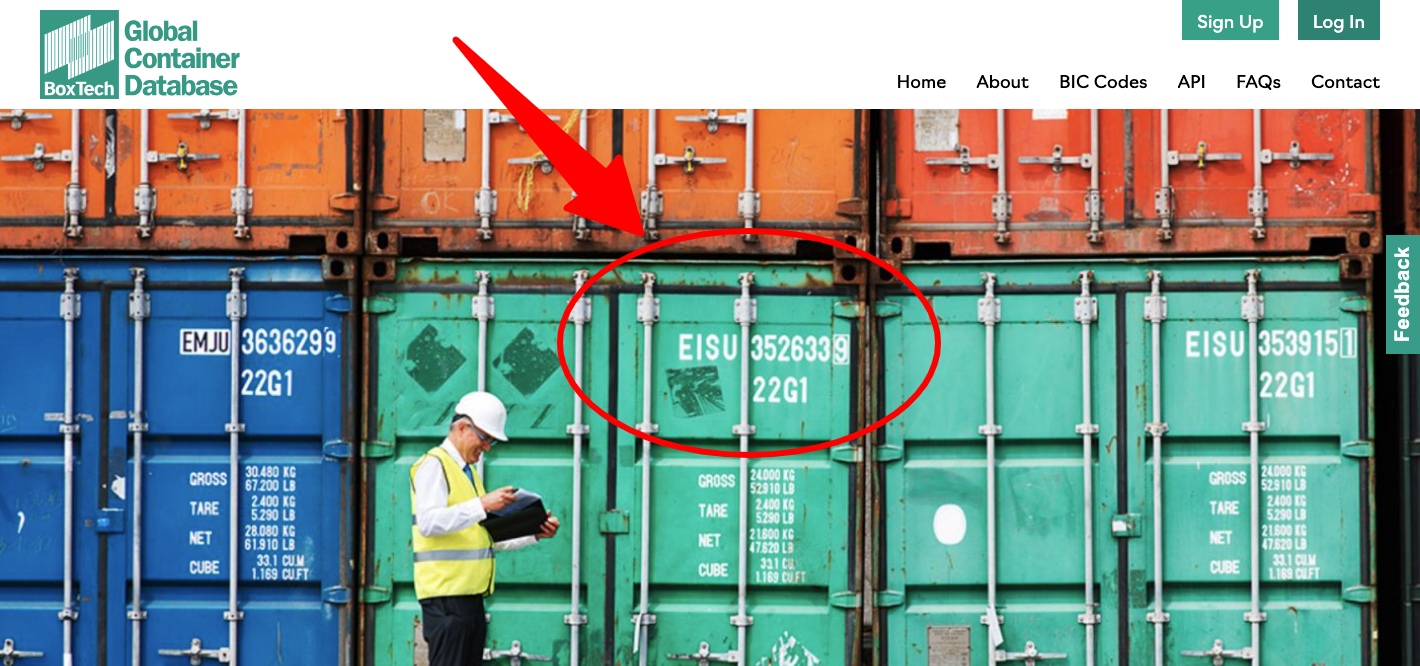
The code is written on the top right of the door and on the sides of the container. It consists of four letters and seven numbers. For example, for container HLXU8072776:
– HLX refers to the company that owns the container, Hapag-Lloyd.
– U represents the type of container, in this case a freight container.
– The remaining digits identify that specific container.
![]()
Shipping and cargo companies often have free public databases through which you can track the latest movements of their containers. You can find out the owner of the container using BIC’s website. Some websites, like track-trace, as well as paid marine intelligence tools, have scraped these various databases, however you will often find more detail by going to the shipping companies website directly and searching “container tracking.”
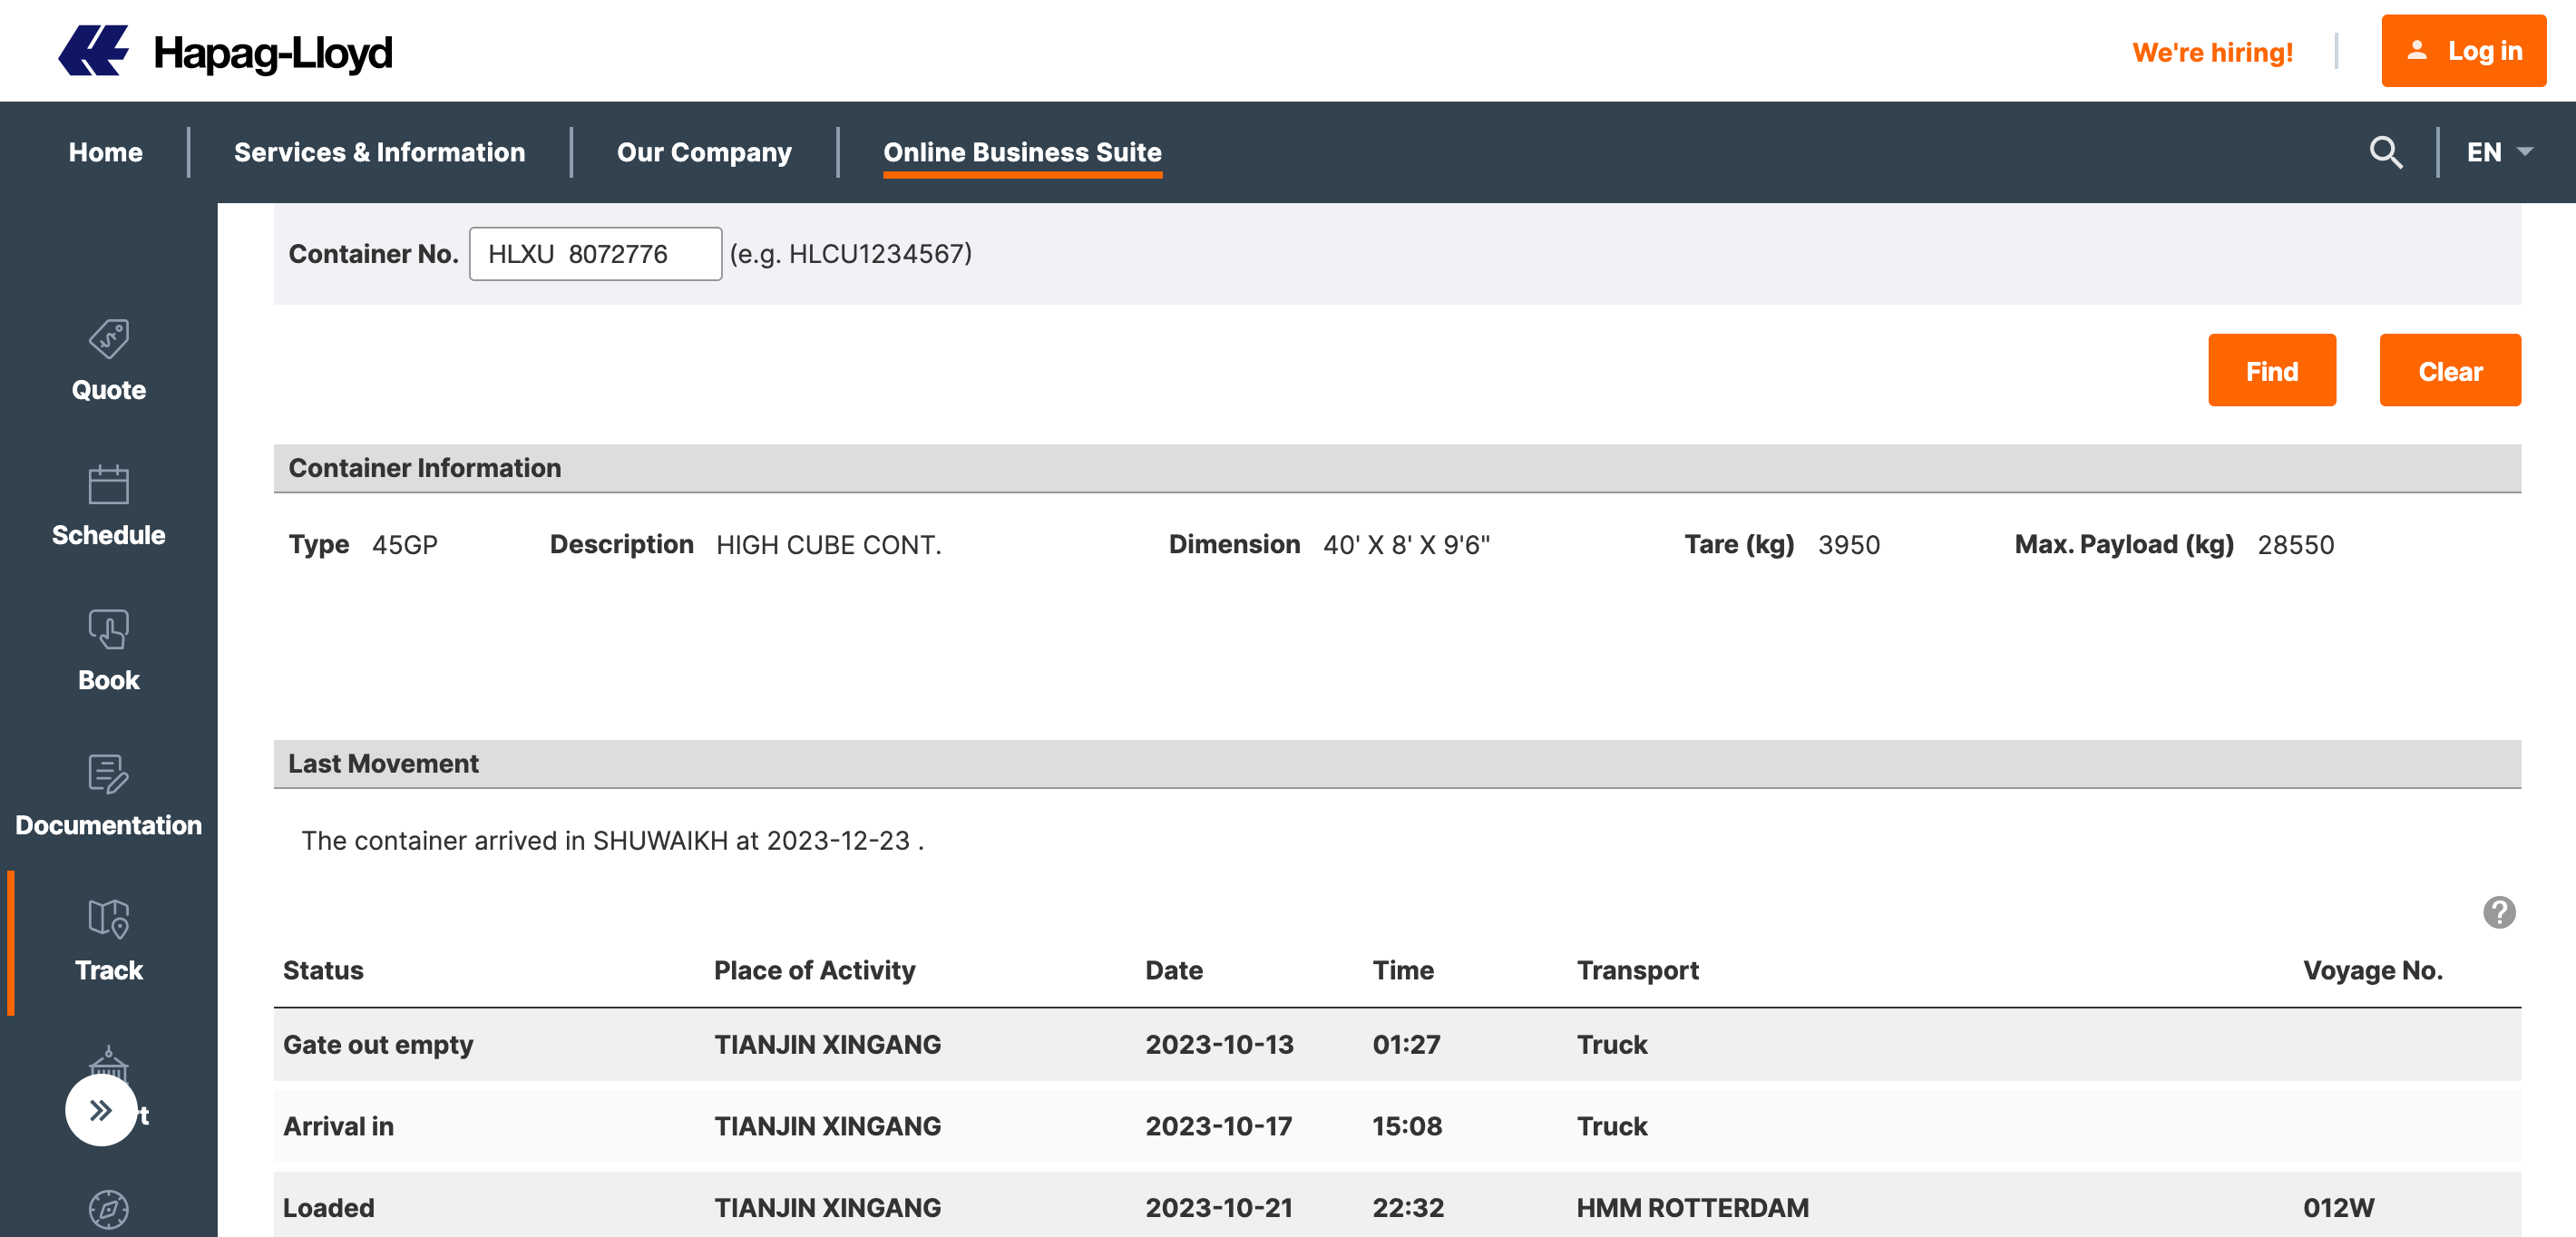
There are a few major limitations of container tracking, which ultimately led to several dead ends during our investigation. The data provided by different companies is not uniform and there are often gaps. Most of the time you can only see recent movements and not historical data, so you need to find an active shipment and track it in real time.
If you want to know which companies are involved in imports and exports, the most useful documents are “bills of lading” which are required for all international shipments. They include details about the goods, companies and ports involved in the shipment. In most countries these are not publicly available documents, but some countries do publish some bill of lading information, including the U.S.
These are then compiled by commercial trade databases, like Panjiva and Datamyne. They charge for access to the data and vary widely in the countries covered and what data is included, so make sure the fields most relevant to your investigation are included before paying for access.
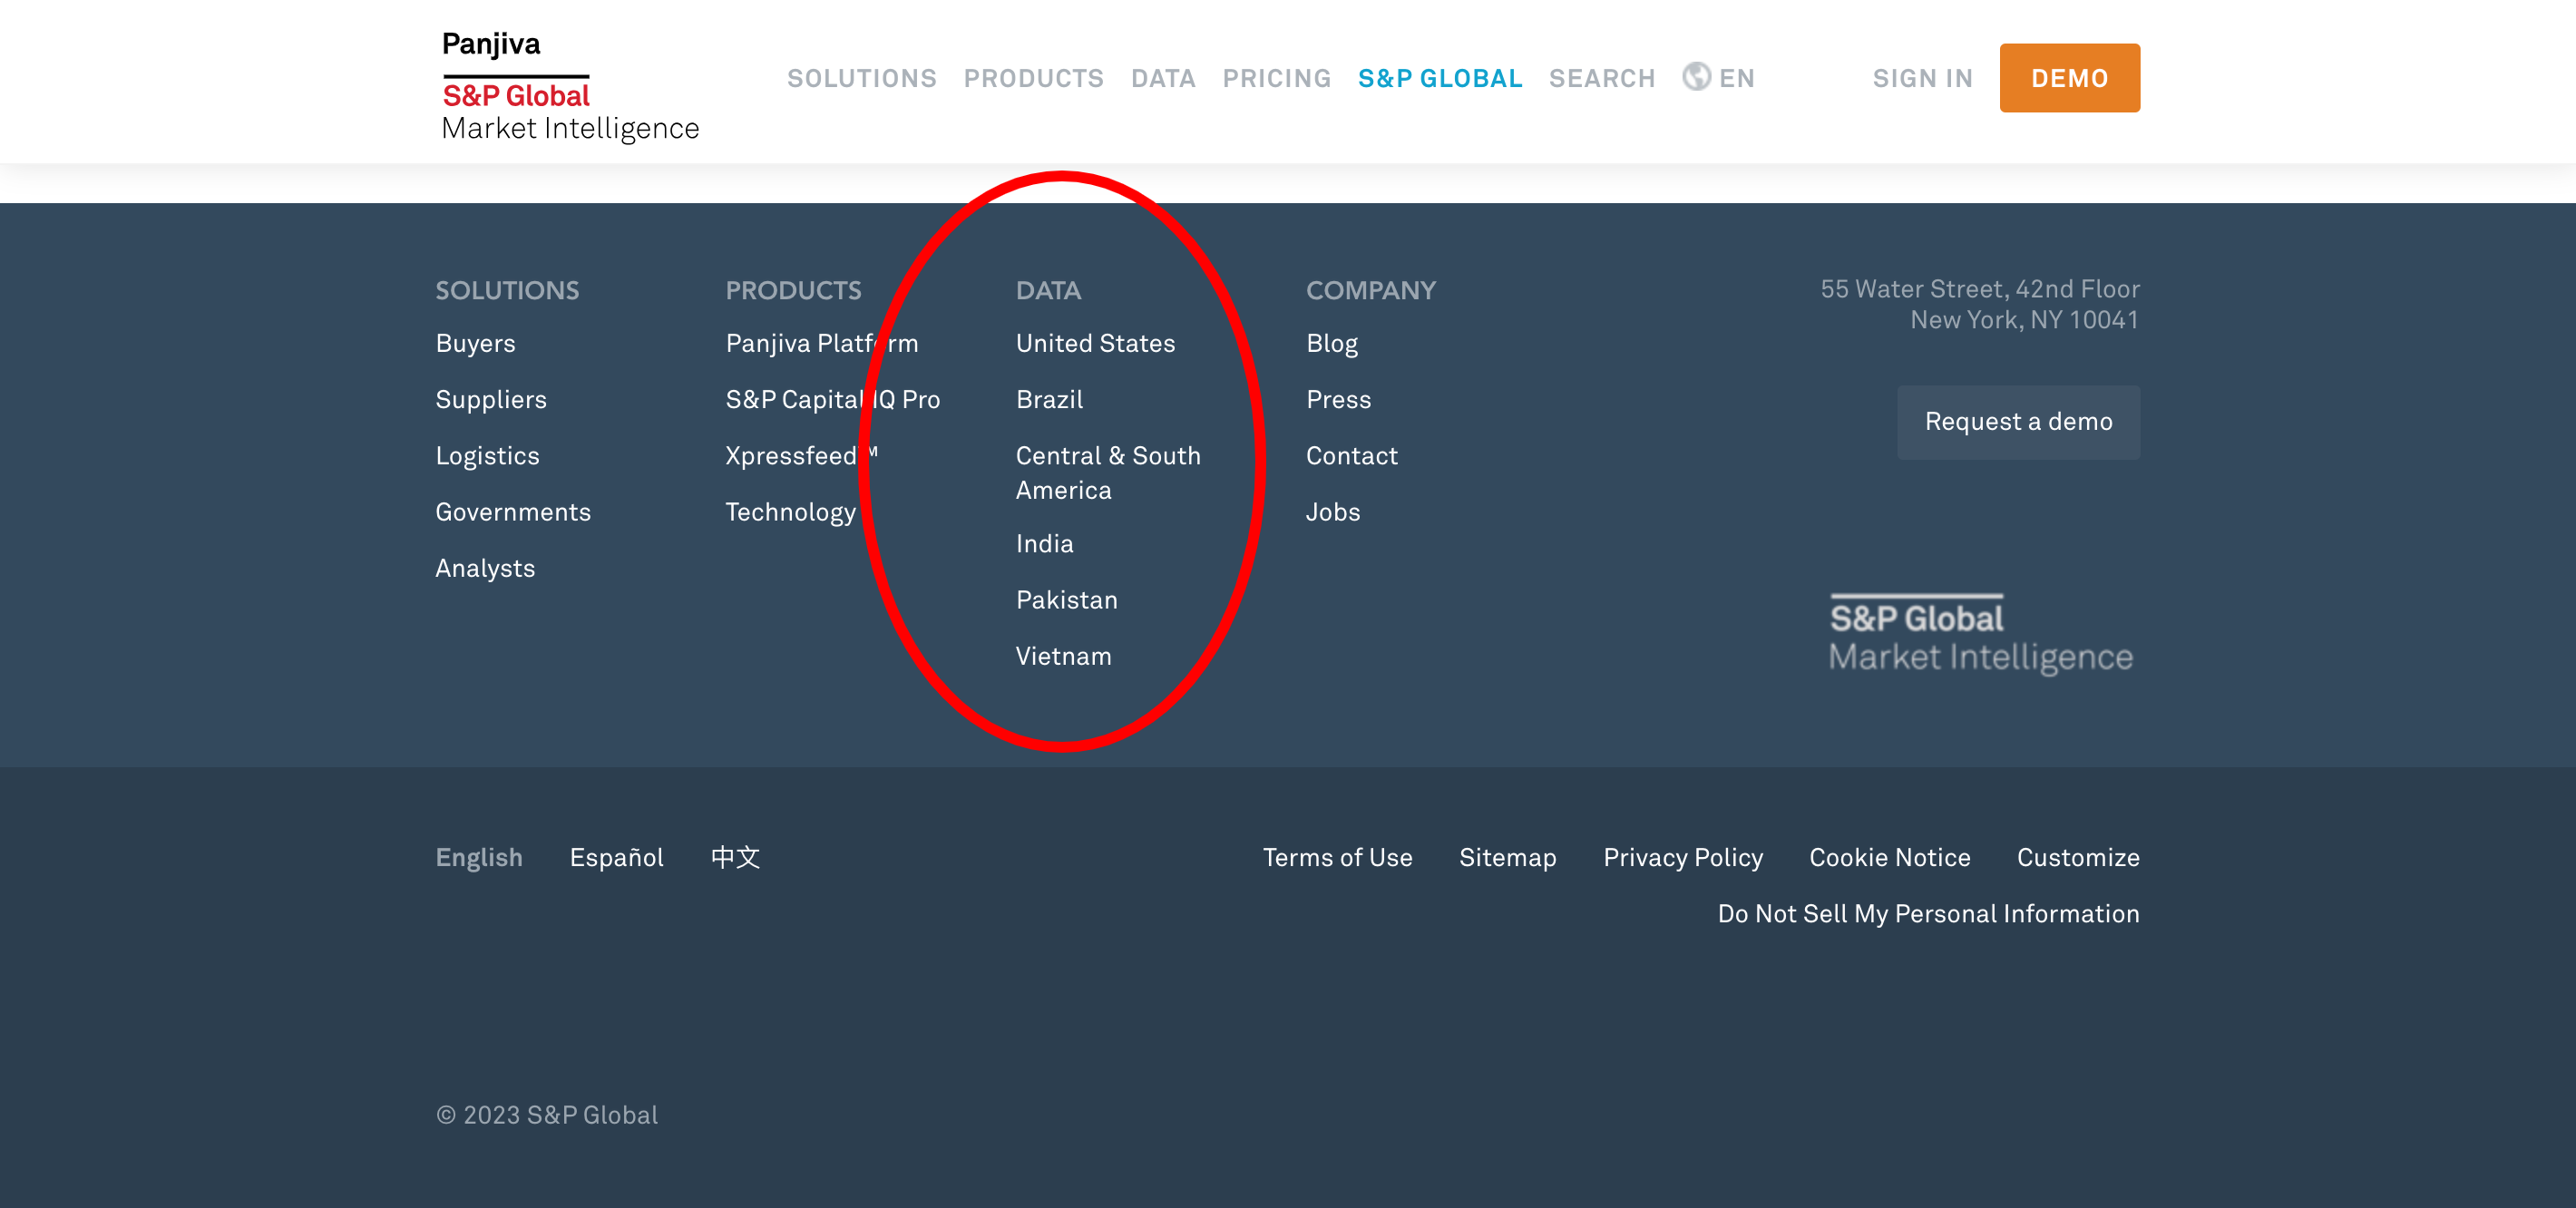
Most countries exporting plastic waste to Myanmar, particularly European countries, do not make bill of lading data public. However, U.S. bill of lading data was useful, both to identify the Canadian and U.S. companies exporting from U.S. ports but also to confirm what sources had been telling us: that countries were using Thailand as a transit route to send plastic waste to Myanmar.
Because of Myanmar’s restrictions on plastic waste imports, sources in Myanmar and Thailand told us they prefer to import plastic waste via Thailand, where checks are limited on goods in transit, and then smuggle it across the porous land border into Myanmar.
This does not appear in official trade statistics. And it is buried deep in the bill of lading databases. But by searching bills of lading by “keyword=Myanmar” rather than filtering by “country of final destination=Myanmar” we found numerous shipments with the destination listed as Thailand but the description noting that it was “in transit cargo to Myanmar.”
While Thailand and Myanmar’s bill of lading data is not publicly available, we were able to get some leads on the companies involved through the list of exporters on the Plastic Intelligence Unit (see above.)
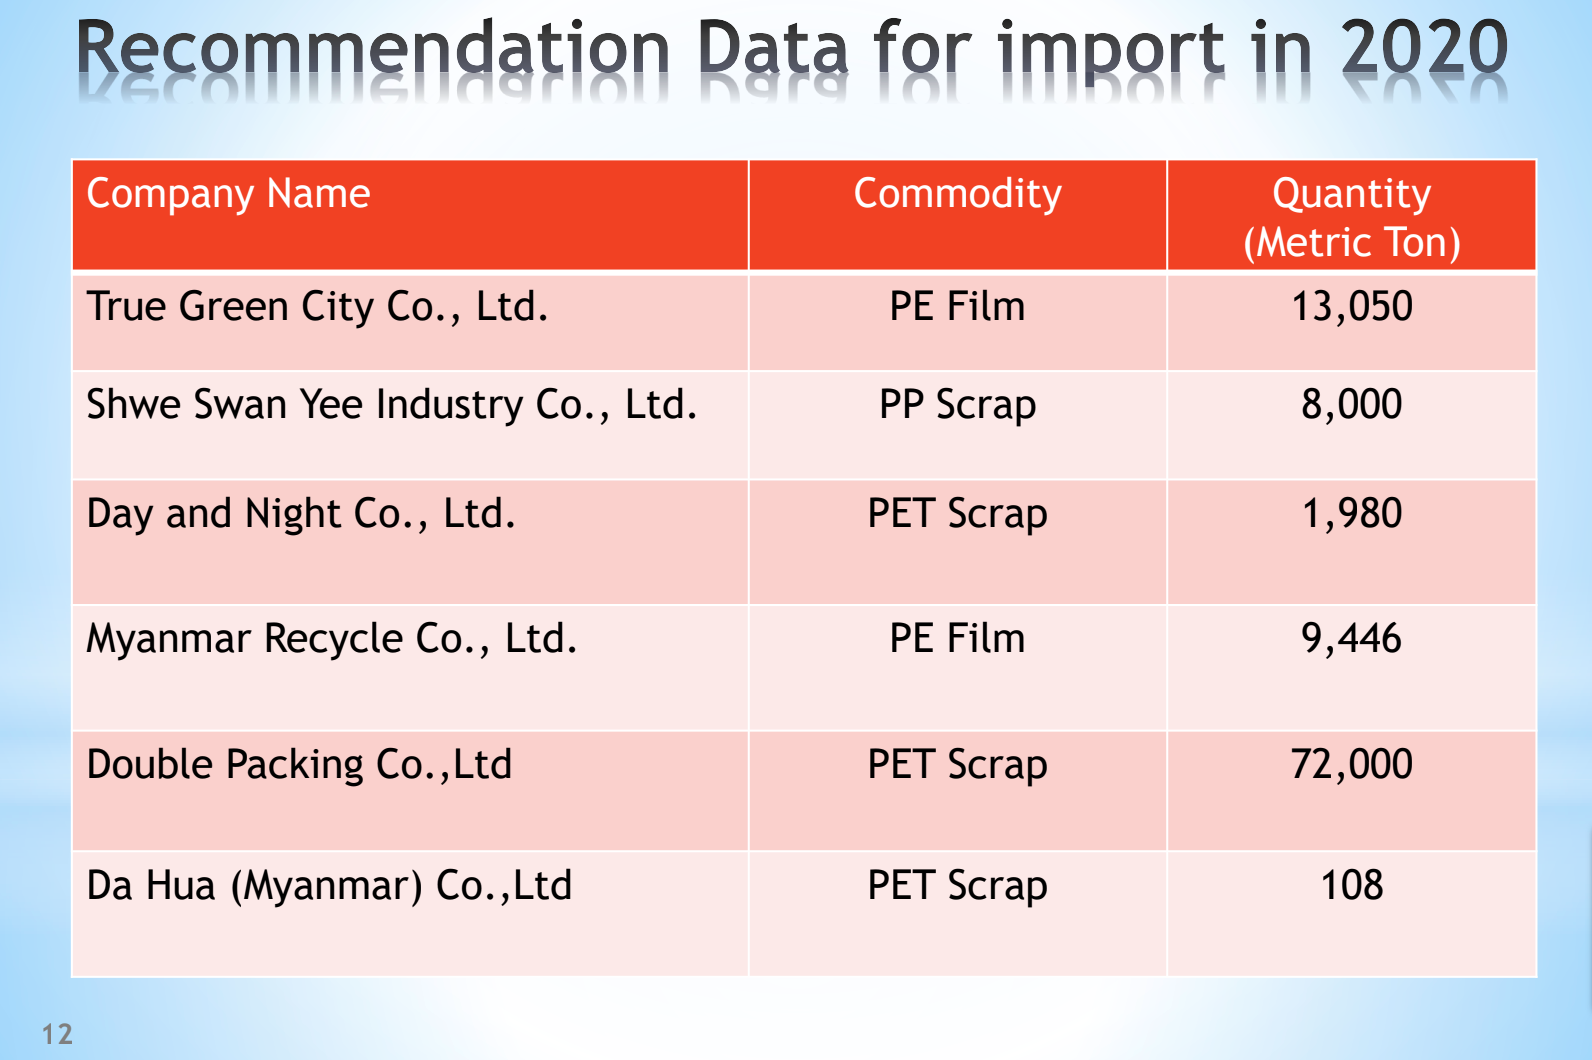
We also located a list of approved importers in Myanmar through advanced Google search. By searching “Myanmar” AND “plastic” and “filetype:pdf” we found annual presentations by environmental officials in Myanmar to a regional body working on illegal waste shipments, which included lists of approved importers in Myanmar, a good starting point for our reporters to begin interviewing companies on the ground.
The data sources listed above would have been hard to navigate and impossible to verify without extensive ground reporting in Thailand and Myanmar.
In Myanmar, reporters collected samples of foreign plastic dumped in a neighbourhood of Yangon and spoke to local residents about the damage it is causing. Journalists in Thailand, Myanmar and exporting countries interviewed dozens of people involved in the supply chain bringing plastics into Myanmar, from logistics companies to border smugglers, recycling factories and waste collectors.
This investigation would not have been possible without our reporting partners Frontier Myanmar and Prachatai and talented freelance journalists in Myanmar and Thailand. Many of the journalists involved cannot be named, or their roles elaborated in detail here, for security reasons.
We are also grateful for the feedback and advice we received on the methodology from many experts in the field, including Jim Puckett from the Basel Action Network, Punyathorn Jeungsmarn from the Environmental Justice Foundation, Lauren Weir at the Environmental Investigation Agency, Willie Wilson, Jan Dell, Dean Plant at Greenpeace and others who cannot be named for security reasons. Reporting for this investigation was supported by the Investigative Journalism for Europe (IJ4EU) fund.

