04.12.2023
France’s Digital Inquisition
Taking apart the secretive fraud detection algorithm that scores half of France’s population but pursues the most vulnerable.
Published with

INVESTIGATION
Across Europe, welfare systems are increasingly deploying predictive risk assessments. The scores they produce can have life-changing implications for some of the continent’s most vulnerable populations. Over the past two years, Lighthouse Reports and its media partners have used freedom-of-information laws to obtain and take apart these systems from the inside out. Our reporting has travelled across the Netherlands, Spain, Denmark, and Serbia and found evidence of discrimination, privacy invasions and fundamental design flaws — and told the stories of those most affected.
Lighthouse Reports partnered with Le Monde to investigate an algorithm deployed by France’s Caisse Nationale des Allocations Familiales (CNAF), the agency responsible for the French social security system. The algorithm, deployed for more than 10 years, attempts to predict which benefit recipients are committing fraud. All of the more than 13 million households, — representing nearly half the population — who receive some type of benefit are assigned a risk score. Using French freedom-of-information laws, Le Monde obtained the source code for three risk-scoring models deployed by the CNAF between 2010 and 2023.
This far-reaching access enabled Le Monde and Lighthouse to take apart the model and test which types of people were more likely to be flagged for investigation. In December of 2023, we co-published a four-part series based on the results of our analysis, interviews with insiders, and testimony of benefit recipients flagged for investigation.
In this methodology, Lighthouse and Le Monde explain how we analysed the CNAF’s algorithm to demonstrate that it systematically targets people in the most precarious situations while making it nearly impossible for the better off to be investigated.
France is an early member of a club of European nations that have deployed risk scoring in their welfare system. In 2010, officials deployed an algorithm that scores and ranks the country’s millions of benefit recipients by their alleged fraud risk. Until now, benefit recipients have had little insight into the risk score assigned to them — but hundreds of thousands have experienced the consequences.
Those flagged as high risk are subject to special investigations where fraud controllers are empowered to visit people’s homes unannounced, count toothbrushes to guess how many people live there, question their neighbours and scour bank records. Of the more than 100,000 people flagged annually for such investigations, nearly seven in ten are selected because of a high risk score. For vulnerable recipients who struggle to navigate the complex rules of the French social security system, the risk of their benefits being reclaimed or terminated is high — even if they unintentionally committed mistakes.
Use of the social security system in France is widespread and benefits like family subsidies are used by people across the socioeconomic spectrum. We set out to investigate whether there are patterns in which profiles received the highest scores. Our analysis found that the model systematically assigns higher scores to vulnerable people, including single parents, people who struggle to pay bills, and people who receive disability benefits. This includes characteristics that are explicitly protected under French anti-discrimination law and arguably, are what led them to need benefits in the first place.
Over the past two years, digital rights groups La Quadrature du Net and Changer de Cap have tirelessly campaigned for greater transparency for algorithms deployed in the public sector. In late 2022, they successfully argued in front of France’s Commission for Access to Administrative Documents (CADA) that the CNAF should have to release the source code for previous versions of its risk assessment algorithm. Their own analysis of many of the same materials we received can be found here.
In June of 2023, Le Monde requested the source code and documentation for the CNAF’s fraud detection model. The CNAF disclosed redacted source code for the current model, which has been deployed nationally since 2020. While most of the variable names in the code were redacted (ie. renamed to “variable_1”, ”variable_2”), ten variables were still visible. It is unclear whether this was intentional.
The agency sent full source code for the models used between 2010 – 2014 and 2014 – 2020 with variable names left unredacted. In addition to disclosing source code, the CNAF also disclosed aggregate statistics from 2020 to today concerning investigations started by their current model.
The three risk-scoring models disclosed by CNAF are constructed using logistic regression, a relatively simple machine learning algorithm. Similar to other supervised machine learning algorithms, logistic regression combs through datasets in order to learn which characteristics are most predictive of a target (e.g. mistake or note mistake).
The CNAF trains its models on households who were randomly investigated as part of the Paiement à bon droit Fraudes (PBDF), an annual survey. Unlike other models we have investigated, this means that the CNAF’s model is presumably trained on a large, representative training dataset.
In a training manual obtained by Le Monde for the current model, the CNAF writes that its investigations are labelled according to the amount of money the CNAF has overpaid the beneficiary. According to the manual, it decides to train its model to detect monthly overpayments of €600 euros or more that have occurred over a period of at least six months. It justifies this choice of label because it is “neither too rare nor too frequent” and “covers 98% of fraudulent payments.”
All of the three models are written in SAS, a programming language designed for statistical analysis. In order to calculate the risk score, the code first loads a number of variables. Each of the possible values a variable can take on, such as has_children or no_children, is then assigned a coefficient (ie. weight) between -0.81 and +0.89. The coefficients are added to create a raw score between -12.89 and 9.83. Finally, the raw score is run through a squasher function that outputs a probabilistic risk score between 0 and 1, where 1 is the highest risk of fraud. A raw score of 0 corresponds to a risk score of 0.5.
In order to ‘squash’ the raw score, logistic regression models use a sigmoid function. This means that the relationship between the raw score and the risk score is not linear. Rather, the risk score rises steeply towards one at the centre and then levels off as it approaches one.
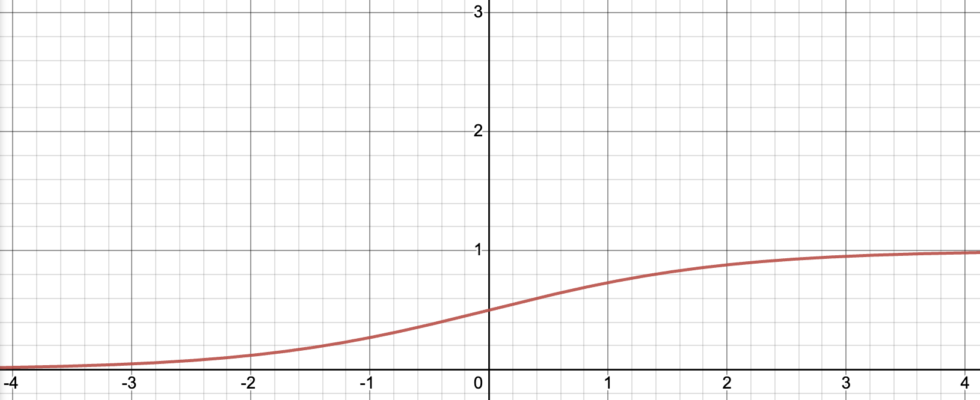
This non-linear relationship makes it difficult to quantify the impact of different variables on the raw score. The effect of a variable on a raw score is always the same whereas the effect of a variable on the risk score changes depending on how high or low the risk score is. A variable will have the most effect on the risk score when the raw score is close to zero.
For the purposes of our analysis, we use the raw score whenever we compare the effect of different traits. We use the risk score whenever we want to illustrate how different traits move an individual closer to or further away from the high-risk threshold that flags someone for investigation.
Nearly half of France’s population is scored each year by the model. In principle, this means that a wide variety of people are at risk of being flagged for an investigation. We wanted to test which profiles receive high scores in practice and why. For the purposes of our analysis, we focused on the model deployed between 2014 and 2020 because it was the most recent unredacted version — although we also tested the 2010 to 2014 model.
Our analysis looked at all of the 33 variables used by the 2014 to 2020 model, but we were especially interested in testing variables related to a beneficiary’s demographic features and their financial resources. We were further interested in variables relating to characteristics covered by French anti-discrimination law, which prohibits direct or indirect discrimination on the basis of family status, age, disability and “economic vulnerability.”
In response to a request for information, the CNAF released aggregated outcome data on the effectiveness of its model. The data covers the more than 700,000 investigations that have been started by the model since 2019.
Of the households flagged by the model, 35 percent had to repay part of their benefit to the CNAF. This amounts to an average of €821 euros repaid per investigation for a total of approximately €604 million euros since 2019. Seventeen percent of investigations started by the model conclude that the CNAF actually owes money to the beneficiary.
We could not compare the model’s performance against randomly-started investigations from the same timespan. However, a document disclosed by CNAF states that approximately 15 percent of random investigations in the 2016 and 2017 Paiement à bon droit Fraudes survey concluded that a beneficiary owed money to the CNAF.
In order to calculate risk scores, the CNAF’s model uses 33 variables that in total can take on over 100 values. These variables range from the age of a beneficiary’s children to the types of benefits they receive to the number of addresses they have lived at. More than half of the variables relate to the demographics of a beneficiary and their financial resources. The rest relate to their interactions with the CNAF and changes to their address.
When we examined the individual impact of the values these variables can take on, we found stark differences. Generally speaking, variables that capture precarity increase risk scores. You can see Appendix II for the full single variable results.
– For variables related to financial resources, having a high income dramatically reduces a beneficiary’s risk score. Meanwhile, having a low disposable income and receiving benefits for low-income households increase a beneficiary’s risk score.
– For variables related to a beneficiary’s characteristics, being young and receiving disability benefits increase a beneficiary’s risk score.
– For variables related to a beneficiary’s family and relationships, having children, especially if they are older than 18, increases a beneficiary’s risk score. Being divorced and declaring a change to your family situation (e.g. a child moving out, a new partner) dramatically increases a beneficiary’s risk score.
After establishing which variables had the most substantial impact on scores, we created profiles — combinations of variables — to see which types of people were especially at risk of being flagged.
We constructed profiles of benefit recipients based on some of the most impactful characteristics from the single variable findings.
For each profile, we kept our variables of interest constant. For example, for our struggling parent profile we set the has children variable to True and their income per household member to the value €577 to €942 euros. See Appendix I to see which variables we kept constant for each profile. We then varied all other variables to calculate the minimum, maximum and average raw score per profile. Finally, each of these was fed through the sigmoid function and converted to a risk score. For a more detailed explanation of how we calculated the average risk score, see Appendix III.
While CNAF’s model is deployed nationally, investigations are carried out by regional CNAF offices. This means that the risk score distribution — and hence high risk cutoff — presumably is different per region. Statistics provided by the CNAF however show that 89 percent of the beneficiaries flagged by the model have a risk of score of 0.6 or higher. We therefore used 0.6 as an approximate high risk cutoff.
We found large disparities in which profiles were more likely to pass the high risk threshold that would leave them flagged for an investigation. A family with stable income has an average risk score of just 0.33. Nearly all other variables would have to be set to values that increase their risk score for them to pass the high risk threshold. Meanwhile, a person who works and receives disability has an average risk score of 0.66, which is already past the high risk threshold.
The majority of the variables related to a beneficiary’s behaviour capture their interactions with the social security system over the last 18 months. The values for these variables — as well as other variables — are divided by hard cutoffs. We do not know how these cutoffs were determined, but the result is that small changes in behaviour can impact the risk score in erratic ways.
The variable Months since last email sent to CNAF, for example, can take on three values. If it has been less than two months since the beneficiary has sent an email to the CNAF in the last 18 months, their risk score moves down. If the last email they sent was between 3 and 4 months ago, their score moves up. The minute it has been 5 months, instead of 4 months, since they last sent an email their score again decreases.
We found that the seemingly arbitrary cut-offs used by CNAF’s risk-scoring model could push beneficiaries who would otherwise not be flagged over the high-risk threshold.
A beneficiary with a risk score of 0.52 will not be flagged investigation. But if it has been between 3 and 4 months since they last sent an email to the CNAF, they will suddenly be at risk of being flagged.
Obtaining access to runnable code / risk-scoring models is difficult. The materials we acquired enable us to test the model and gain far-reaching insight into how it would score different types of people. Nonetheless, we were not able to access key materials that would have allowed us to carry out deeper analysis.
An important limitation of our approach is that we do not know the relationship between the different variables that we analysed. For example, having a child between 12 and 18 (which increases risk scores) is likely correlated to being above 34 (which decreases risk scores). In practice, this means that certain types of people may receive lower or higher scores than the profiles we constructed suggest.
Nonetheless, the limited data we could find on which demographic groups are investigated in general by the CNAF align with our results concerning which groups are more likely to be flagged. An analysis of investigations in 2015 published by the CNAF showed that single parent families were subject to more than double the number of investigations compared to their share in the beneficiary population. The CNAF did not respond to our request for more current statistics.
Another limitation is that we were not able to obtain granular outcome data (ie. whether someone who was flagged by the model had to repay money to the CNAF). In an ideal world, we would have had outcome data broken down by protected categories both inside and outside of the input variables. This would enable us to test whether the model flags women or people of an ethnic background at disproportionate rates. In addition, this would enable us to test whether the different demographic groups flagged by the model actually make more mistakes and compare false positive rates between groups.
The CNAF did not respond to a detailed list of questions from Lighthouse Reports and Le Monde requesting, among other things, clarification on specific variables and more comprehensive statistics on the beneficiary population. Instead, the CNAF responded with a general statement and agreed to an on-the-record interview.
In its statement, the CNAF claimed that the goal of its risk-scoring model is not to “establish a risk score, but rather to classify files according to their degree of complexity.” It also pointed out that some investigations started by the model conclude that the CNAF actually owes the beneficiary money.
The agency defended the variables it uses in its model, arguing that they are statistically substantiated and are used “without discriminatory intent.” It did not provide evidence to back up its claim that the variables are statistically substantiated. In an interview with Le Monde, CNAF director Nicolas Grivel confirmed that the agency has never audited any of its models for bias or discrimination.
The CNAF wrote that it had been reflecting on its use of algorithms and the “heightened expectations when it comes to the transparent use of data.” It continued that it had convened a multi-disciplinary team of sociologists, data scientists and public policy specialists to examine its use of risk-scoring. The CNAF ended by stating that conclusions of the team are expected in 2024 and will be published as a “contribution to public debate on these important issues.”
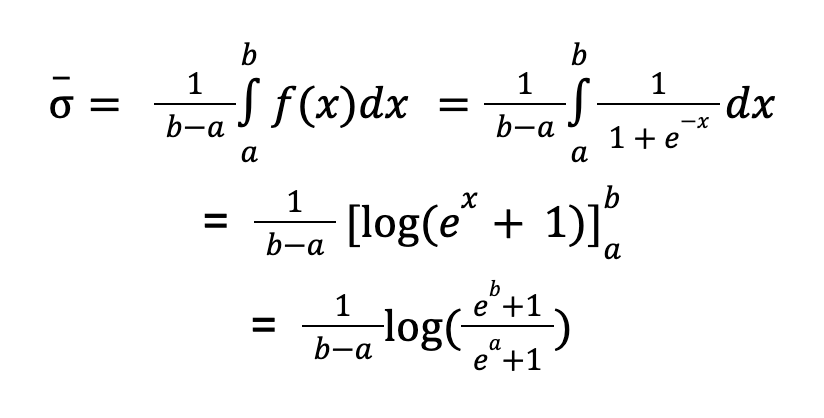
For each of the profiles, we calculate the minimum and maximum raw score and then run each of these through the Sigmoid function to convert them into a risk score. In order to calculate an average score, we take the average value of the Sigmoid between two bounds, a the minimum and b the maximum.